COHERENT GT DEBUGGER
The Microsoft Flight Simulator SDK comes with the Coherent GT Debugger, which can be found in the following directory:
<SDK_ROOT>\Tools\CoherentGT Debugger
This tool permits you to debug the HTML gauges within an aircraft. To use this tool you should first start Microsoft Flight Simulator, then in the project editor open the aircraft package and build it. Once the package is built, the aircraft should be available for use in the aircraft selection screen, and you should choose it and start a flight. Once in the simulation itself, you can run the Debugger.exe which will open a window that looks something like this:
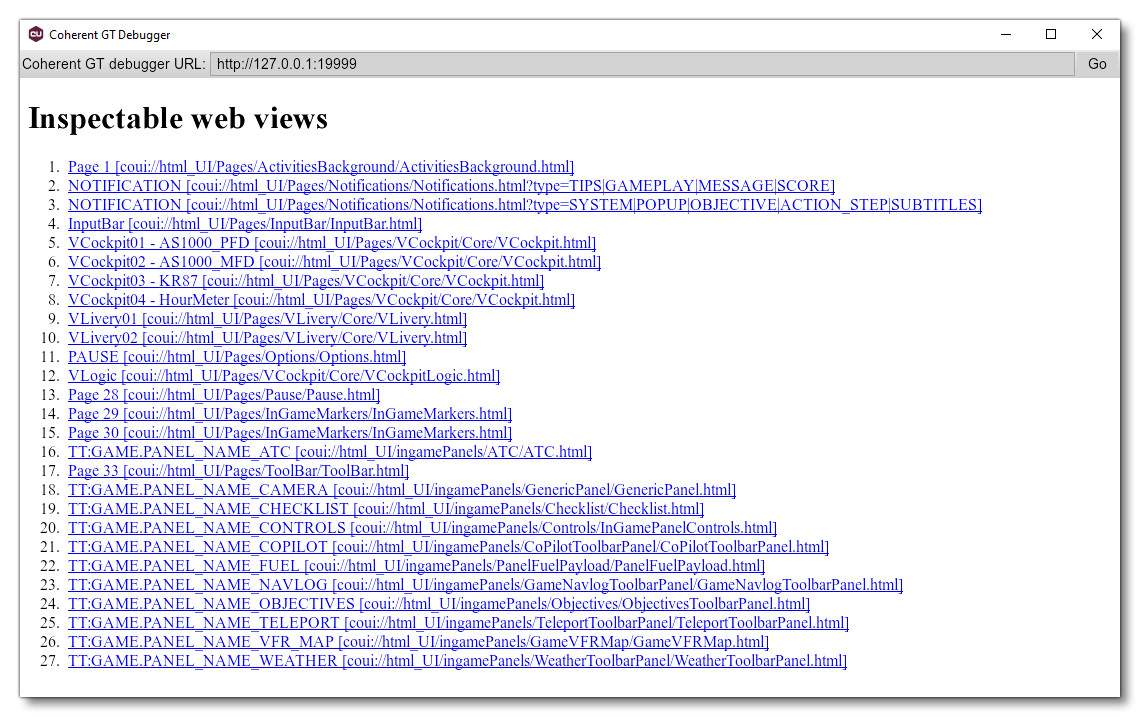
If nothing is visible in the window when you start it up, clicking the Go button should show all the available web views. If that still doesn't work, ensure that the URL being debugged is set to the following:
http://127.0.0.1:19999
The main page will show a list of items that can be "inspected" in the Coherent GT debugger, and most of these will be related to the UI of the simulation. However, for aircraft using the HTML gauges, there will also be a list of gauge elements that can be inspected, titled with VCockpit:
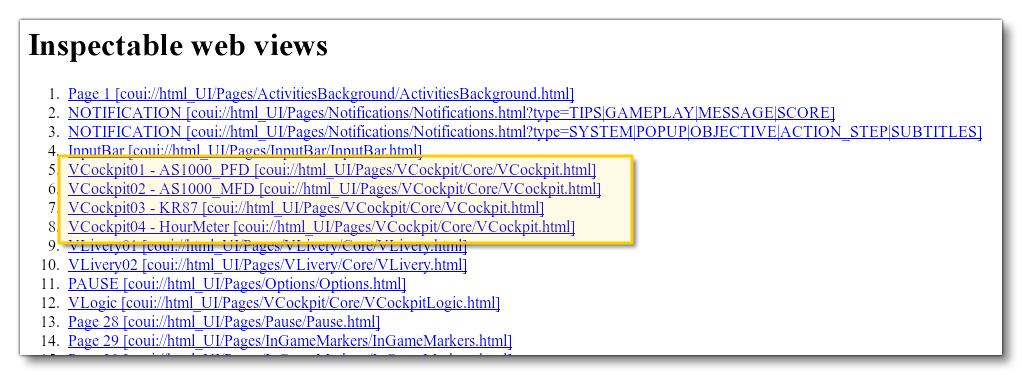
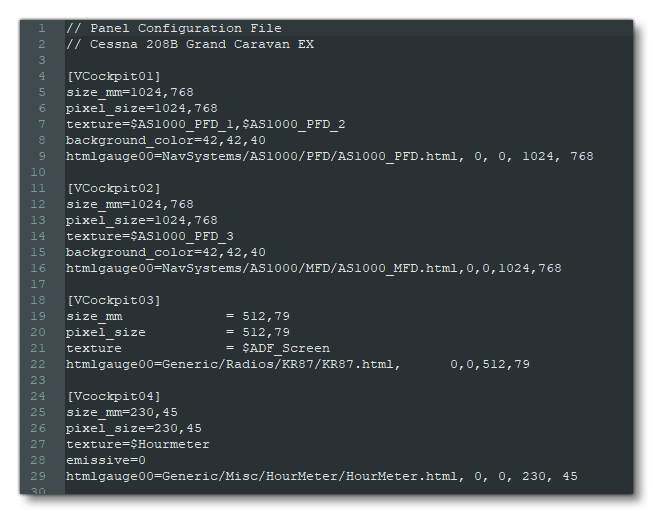
These relate to the different virtual cockpits defined in the Panel.cfg file for the aircraft:
When you click on any of the VCockpit entries in the list, then you will be taken to the main debugger where you have a number of different tools and views that can be used to see how the selected item is performing:
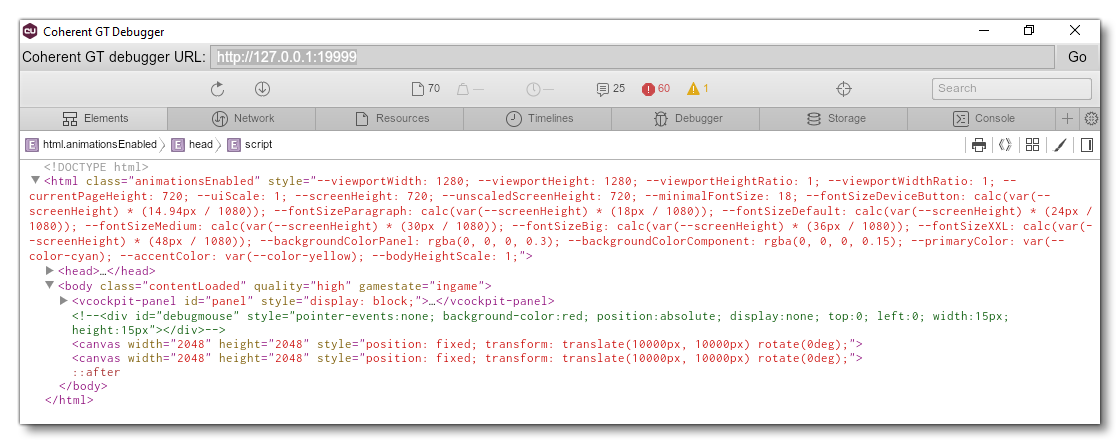
From this view you have access to all the debug tools you would expect from an HTML/JavaScript debugger, and you can edit and tweak values in real time to see what effect they will have within the simulation (all changes are temporary and only for previewing things "live" within the simulation).
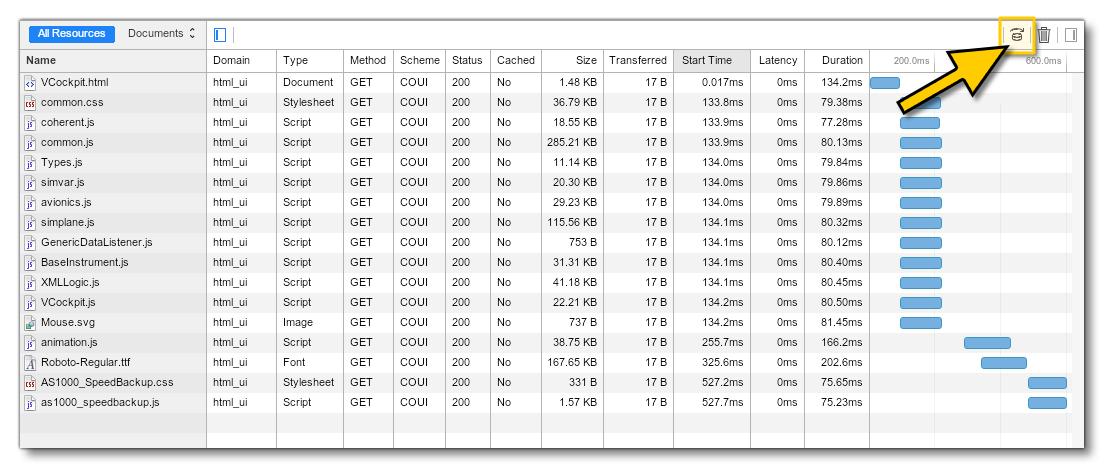
Also note that, each time you launch Coherent, you should check the Ignore Cache button in the network tab to be sure that Coherent refreshes all the files:
For full details on the debug options please see the Coherent documentation from the following link: