BezierCurve
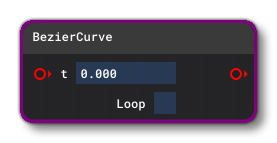 This Node is used to retrieve a single value along the length of a bezier curve based on the time input (t), and the node also permits you to set the curve to loop or not. The curve itself is defined through the Inspector window:
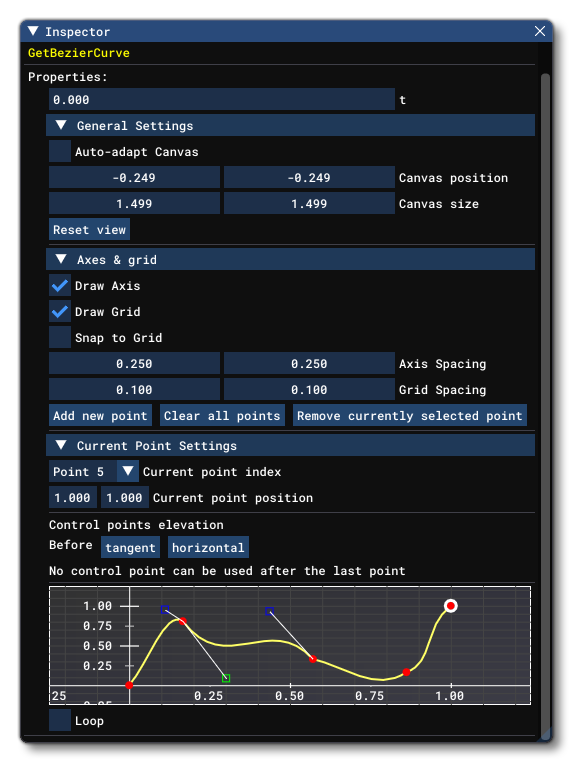 The elements available in this window for editing the bezier curve are as follows:
t
At the very top of the window, you can set a fixed value for t, which is the time value along the X axis. You can also set this value in the node itself, or using the Node Input.
General Settings
- Auto-adapt Canvas: Selecting this option will automatically resize the curve canvas as you drag or change the position of the points. When this is enabled, neither the Canvas Size nor the Canvas Position fields can be edited.
- Use Custom Bezier: This enables an alternative way of rendering the curves that may or may not give a better result than the default method.
- Canvas Position: When the Auto-adapt Canvas option is disabled, this can be use used to set the X/Y position of the view within the canvas. These values will update automatically when Auto-adapt Canvas is enabled.
- Canvas Size: When the Auto-adapt Canvas option is disabled, this can be use used to set the size (width/height) of the view within the canvas. These values will update automatically when Auto-adapt Canvas is enabled.
- Reset View: Clicking this button will reset the canvas position and size back to their default values.
Axis And Grid
- Draw Axis: When enabled, the X/Y axis will be drawn for reference in the canvas view.
- Draw Grid: When enabled, a grid will be drawn over the canvas. This is purely a visual reference, unless you also enable the Snap To Grid option, in which case points on the profile will snap to the grid positions.
- Snap To Grid: When enabled, any points added to the curve or any points being edited within the profile, will be snapped to the grid. This option is independent of whether Draw Grid is enabled or not, and you can set the grid resolution using the Grid Spacing inputs.
- Axis Spacing: Changes the spacing on the X/Y axis in the canvas.
- Grid Spacing: Changes the X/Y resolution of the canvas grid. Editing these values will affect how points are added or edited when the Snap To Grid option is enabled.
Add New Point
This button sets the mouse cursor into "add point mode" and clicking anywhere in the canvas will add a new point to the curve at the given position. While in this mode, the button will change to Cancel Add New Point, which can be clicked to exist the "add point mode".
Clear All Points
This button will clear all the points that you have added into the curve, essentially resetting it to the default state.
Remove Currently Selected Point
This button will remove the current point that is selected. You can select a point either by clicking on it, or by changing the Current Point Index value (see below)-
Current Point Settings
- Current Point Index: The index of the current point in the profile being changed. Note that index values start at 0.
- Current Point Position: The X/Y position of the point in the canvas. These values will update automatically if you move the point in the canvas, or edit the profile using the gizmos in the simulation. You can also manually input values into these fields.
Canvas
The canvas is the section at the bottom where you can add and edit points on the profile. As you select points you will see additional buttons that can be used to add bezier "handles" to the point enabling you to change the way previous/later points connect:
Clicking the tangent button will add a bezier handle at a tangent to the control point, while using the horizontal button will add the handle along the horizontal (X) axis. These handles can then be clicked on and dragged to generate different forms within the profile:
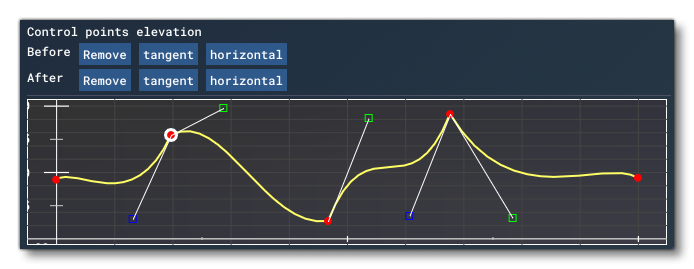
You can also remove these handles to go back to the default interpolation between points by selecting a point and clicking on the remove button.
Loop
This checkbox can be used to generate a looping output based on the input and Bezier curve. When checked, the value used to sample the curve is calculated as follows:
tFinal = fmod(t - xMin, xMax - xMin) + xMin
where
tis the input on the nodexMinis the abscissa of the first point (leftmost) of the curvexMaxis the abscissa of the last point (rightmost) of the curve
Therefore the sampling value is kept inside the abscissa bounds of the curve. For an input t that grows continuously (typically time, for example using the "Age" from a GetInstanceAttribute node), the sampling value will start again at the beginning of the curve every time it reaches the end. If you use loop with an input value that diminishes, then it will sample the curve backward.
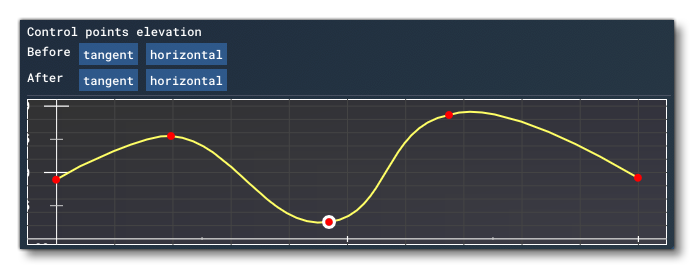
It is important to note that ordinate of the first and last points must be the same if the output value needs to be continuous when the curve is sampled with a value that also evolves continuously, such as time. The following images show examples of a continuous and non-continuous curve:

Node Input
The Bezier Curve takes a scalar (float) input that is used to define the "time" position for sampling the curve data. Essentially this is a position along the X axis that will be sampled, and the value of the curve at that point will be returned in as the Node Output.
Node Output
This node will output a scalar (float) value based on the position along the bezier curve being sampled using the t input and the loop parameter.