VS WASM DEBUGGER EXTENSION
This tool is designed to help with the debugging of WASM modules. It is a Visual Studio extension which modifies part of Visual Studio's debugger to make WASM debugging easier, since - by default - it has some issues.
IMPORTANT! Debugging tools cannot be attached to the simulation executable by default. If you try to do this, the simulation will crash. In order to be able to debug your WASM modules, you must pass in the argument -AllowDebugger to the exe. When using this mode, a debugger can be attached to the simulation, but note that some content will be "hidden" (ie: encrypted packages).
You can find more information on debugging WASM modules here:
The Problem
WASM is used to generate DLLs that can then be used in add-on packages. These WASM files are created from C++ and then converted into DLLs by the package building process. However, sometimes there may be issues with the final DLL due to the way that the WASM compiler and subsequent transition back to C++ for the DLL works. This, in turn, can make debugging the final DLL to find any issues rather complicated, due to some incompatibilities between the WASM environment and the C++ Debugger.
To illustrate this, let's look some possible issues when viewing the call stack of a compiled DLL. Within Visual Studio, navigating through the call stack is indeed possible, but the data displayed in "Locals" will be wrong, which makes it basically unusable. Let's consider the following code:
class C
    {
    public:
        void Func1()
        {
            WASM_FORCE_DEBUG;
            Func2(m_i, m_f);
        }
    private:
      void Func4(bool b)
        {
            WASM_FORCE_DEBUG;
        }
      void Func3(int iArr[5], float fArr[5])
        {
            WASM_FORCE_DEBUG;
            Func4(false);
        }
      void Func2(int i, float f)
        {
            WASM_FORCE_DEBUG;
            int iArr[5] = { i, i + 1, i + 2, i + 3, i + 4 };
            float fArr[5] = { f, f + 1, f + 2, f + 3, f + 4 };
            Func3(iArr, fArr);
        }
        int m_i = 1;
        float m_f = 10.f;
    };
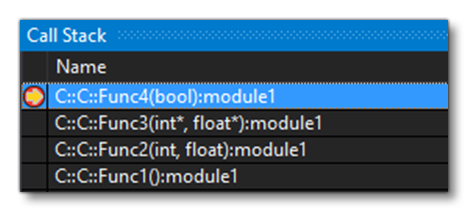
By executing this code and putting a breakpoint in Func4, here is the callstack you will get:

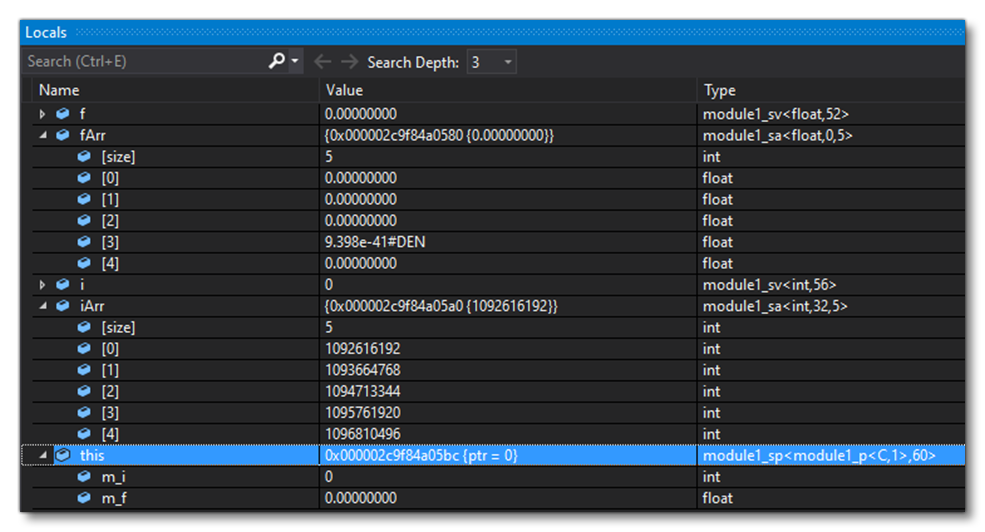
And here are the "Locals", that you would have for Func4:

Everything looks correct and is fine for Func4 it seems. However:

In the case of Func3s local variables, fArr and iArr are displayed as nullptr, which is obviously not the case. And if we check a little bit further:

In the case of Func2, we have some absolute nonsense displayed, eg: this is displayed as nullptr, arrays are wrong, etc… And finally:

In the case of Func1s local variables, everything seems to be great again!
So, as you can, see Visual Studio has some important issues when debugging WASM, most of which we can resolve using the VS WASM Debugger Extension.
Using The VS WASM Debugger Extension
This section gives instructions for using the VS WASM Debugger Extension.
IMPORTANT! Ensure that you have the most up to date version of the extension, as new functionality may have been added in the latest SDK update.
Installing
The SDK Tools folder contains a folder for the extension that contains the following file: WasmExtension.vsix. This extension should be installed in Visual Studio (see here for information).
Debugging
After installing the extension, when debugging your code, you will see a new local variable in every main function scope:
 This variable will be recognized by the extension and will automatically update its environment according to the stack frame inspected, preventing most of the issues outlined in the sections above.
NOTE: The extension won't do anything if you are not working with a MSFS WASM file or you are working with an incompatible MSFS WASM file (by incompatible we mean: outdated, built in Release mode, etc…).
Uninstall
If, for whatever reason, you need to uninstall - or disable - the extension, this is done by going to the Extensions menu in Visual Studio, then selecting the Manage Extensions option. In the window that opens, go to the Installed group, then find the WASM Debugging extension and select either "Disable" or "Uninstall".