SIMOBJECT DEBUG MENU
This page explains the different debug options available to you when using The SimObject Editor (or when debugging an aircraft using the Aircraft menu from the DevMode Debug menu).

For additional details on using the information provided here, please see the section on Tuning The Flight Model.
Aircraft Data

This window is designed so that you can load in a CSV file with real aircraft data and compare it to the performance of the aircraft in the simulation. When you start a flight, the data for specific items will be recorded - the items being set by the various "Data Feed" parameters - and a sample of the data will also be graphed over time at the bottom of the window. The available options here are as follows:
- Pause Recording: when checked, all data recording will be paused.
- Pause At Event: when checked, specific timed events will automatically pause the data recording. The exact moment that the pause will occur will depend on the data feed parameter, with the pause happening when the sample data goes above a specific threshold, as shown in the following table.
Parameter Threshold Units NoneN/A N/A AoA Alpha20 Degrees Pitch25 Degrees Roll60 Degrees Yaw Sideslip Beta25 Degrees Elevator Deflection35 Degrees Aileron Deflection30 Degrees Rudder Deflection30 Degrees Load Factor5 G Vertical Speed3000 ft per minute Vertical Wind3000 ft per minute True Air Speed200 ktas Elevator Force50 lbs, Kg, or Newton Aileron Force50 lbs, Kg, or Newton Rudder Force50 lbs, Kg, or Newton From .CSV25 N/A
Note that this threshold value is calculated as 10% of the maximum value permitted for the parameter.
- Data Feed 1 - 4: Here you can select which parameter to use as the data feed(s).
- Colour 1 - 4: Colours to be used when graphing the data are pre-assigned to the different parameters and will change as you select them. However you can click on this to open a list of colours and choose one to override the preset.
- Units 1 - 4: This lets you select the unit to use for displaying the data feed values. Note that the list will be filtered to only permit those unit types appropriate for the data feed parameter.
- Feed Offset: This slider permits you to offset the data visually in the graph view by +/- 20 frames.
- Load .csv Into Feed 1 - 4: Clicking this will automatically load the CSV file from the given Filename location.
- Save Feed 1 - 4 To .csv: Clicking this will automatically save a CSV file with the feed parameter data to the location given as the Filename location.
WARNING! This will overwrite any existing file with the same name at that location!
- Filename 1 - 4: Gives the path and filename for the CSV file to be loaded/saved.
- Max Time 5s, 15s, 30s, 60s: These option can be used to expand/contract the visual sample shown in the graph view at the bottom.
AP (Autopilot)
 This window displays debug information related to the aircraft AutoPilot. In general this is split into 4 major sections:
- Elevator
- Ailerons
- Rudder
- Throttle
Most of the information in this window is defined through the AI Config file for the aircraft.
Attachments
 This option will open the debug window specific to attached objects used in the Modular SimObjects pipeline. You can find full information on this window from the following page:
Cabin Services

From this window you can see and debug any of the Navigation Services assigned to the aircraft.
Camera Blend

This debug feature is for cameras and will enable an overlay with multiple points of information related to the current camera and the cameras available.
CFD
 This option will open the CFD (Computational Fluid Dynamics) Debug window. This is used to computationally simulate the flow of air around the aircraft and is designed to help you better understand the and improve the aerodynamics and handling of the aircraft.
You can find full information on this window, how to use it, and how it works, from the following page:
Complex Physics Sim

Covers And Chocks
This option will toggle the following menu window on or off:

This menu will only be applicable when:
- the aircraft is in pre-flight.
- the aircraft is stationary.
- the aircraft engines are off.
Under the above conditions, you can then use the menu do show/hide the various covers and chocks that are applicable to the aircraft (assuming that the model has these items included and set up correctly).

For more information on how to set up aircraft covers etc... please see the following pages:
Dirt And Scratches

From this window you can fade in/out a number of detail masks for dirt and scratches on the current aircraft. Not all aircraft have these masks, but when they do, you can click on a slider and drag it to show the mask, or hold Ctrl then click to enter a value. Mouse over the image below to see how these change the aircraft display:

For more information on how to setup the aircraft dirt and grime, please see the following page:
Drag
 This window shows the different values that are associated with - and will affect - the different drag formulas for the aircraft. Values are measured on the aircraft in flight as it is currently being simulated.
ECS / Pneumatic

From this window you can debug the Modular Pneumatics System. For full details of how to use this window, please see the following page:
Electrical

From this window you can debug the Modular Electrical System. For full details of how to use this window, please see the following page:
Engines
 This window displays information about the different engine(s) for the aircraft as well as their position. The data shown in this window can be changed by editing the Engine Config file. Note that from this window you can also open the following tool:
If the aircraft does not have a constant-speed propeller or a turboprop engine, or if neither type of propeller RPM limiter has been initialized via the corresponding parameters in the [PROPELLER] section of the engine.cfg file, or if initialization failed due to invalid configuration (missing required parameters or invalid values), then the window will display an appropriate notification instead of the checkbox that opens this additional tool:
- not applicable for this engine/propeller type - The current engine configuration does not permit RPM limiter functionality.
- is not specified in CFG file - The engine CFG file does not have the required parameters to enable the RPM limiter.
- failed to load - There is some error with the files and the RPM limiter cannot be initialised (you should check the console for more information on the error.
Flight Controls

This window can be used to check the way that the flight controls affect the Pitch, Roll and Rudder.
Flight Performance
 This window is used to create a flight_performance.cfg file, which can then be compared with the POH and manufacturer data for the aircraft, then used to tweak the flight model. The output data is also useful for calculating a vertical navigation profile and the take-off and landing distances required when creating flight plans. For full information on this window and how to use it, please see the following page:
FLT Files

This debug window will display all available FLT files for the aircraft that is currently being flown by the user in the simulation. Beside each FLT file you can see a Load button, and clicking this will load the FLT file and instantly apply the settings. At the bottom of the window you also have the option to Export Current FLT, which - when clicked - will open an explorer window and allow you to save the current FLT file under a different name.
This window is specifically designed to help with setting up the FLT parameters required by Career Mode activities, as well as the Back On Track system.
Fuel

From this window you can debug the Modular Fuel System. For full details of how to use this window, please see the following page:
Ground

This debug window lists all the different contact points along with the data associated with them.
Ground Effect

This debug window can be used to display various different values associated with the ground effect and how it affects various aircraft parameters.
Hydraulic

From this window you can debug the Modular Hydraulics System. For full details of how to use this window, please see the following page:
Input Forces

Interactive Points
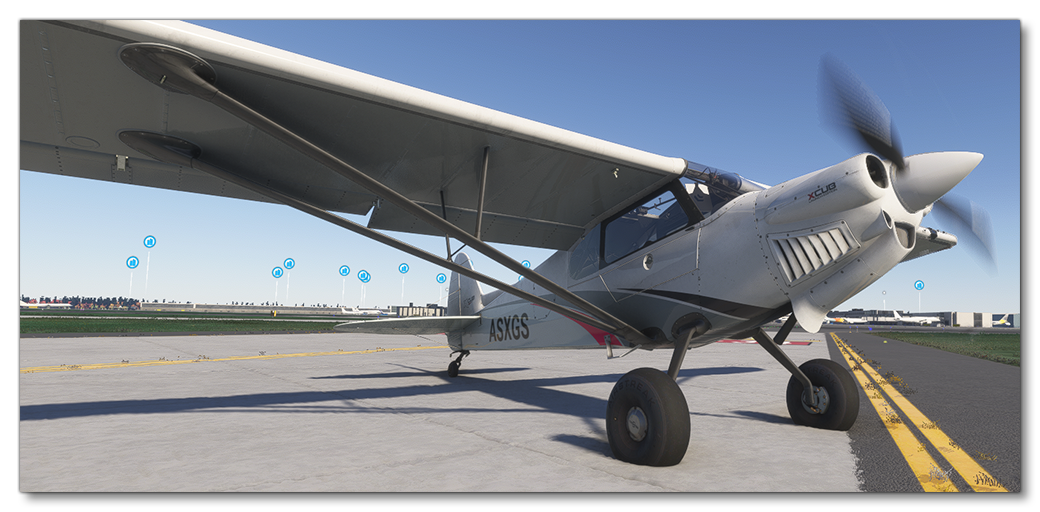
 When this option is selected, the aircraft will show the interactive points overlay. When active, each interactive point will be displayed - colour coded to show which type of point it is - along with it's position relative to the Datum Reference Point. This position, and other values, can be edited from the section in. The colours used are as follows:
 Green: Main Exit
 Orange: Cargo Exit
 Red: Emergency Exit
 Yellow: Gas Trap / Fuel Hose
 Brown: Ground Power Unit
 Dark Blue: Air Start Unit
Legacy
 This debug window is designed to help you update any legacy FSX and Microsoft Flight Simulator 2020 aircraft to work with the updated, modern flight model in Microsoft Flight Simulator 2024. When opened, this window will create a "virtual wind tunnel" and essentially place the aircraft in it and use the legacy values to generate a comparative set of modern flight model values, which can then be added into the
 [CONTACT_POINTS] section of the Flight Model Config file.
The window is split into two parts:
- the legacy parameter values on the right
- the modern flight model values on the left
The idea here is that you use this comparison to update the aircraft CFG files by changing the parameters listed on the right with the values listed on the left. For example, in the image above the legacy parameter lift_coef_delta_elevator has a value of -1.806. However on the left this is represented as the \(C_{LDe}\) value which is -1.334. So you should take this value and in the CFG file edit the lift_coef_delta_elevator to be -1.334 to update the legacy values to suit the modern flight model. Doing this for all the listed values should bring the legacy aircraft parameters close to the values required for Microsoft Flight Simulator 2024.
Lights
 When this is enabled, all the lights that have been defined for the aircraft will be signaled by an overlay of coloured text, and some may also show the name of any emissive effects that have been assigned to them, as well as the range and area over which they will be visible. Note that this overlay will also be automatically enabled when you select the
 [LIGHTS] section in the SimObject Editor.
Each colour used in the overlay represents a type of light, specifically:
 White: Strobe
 Red: Beacon
 Dark Blue: Navigation
 Yellow: Panel
 Green: Landing
Pitch
 This debug window is used for debugging the various parameters related to pitch from the section of The SimObject Editor. When this debug window is enabled, the simulation will be overlaid with a virtual "wind tunnel" showing a schematic of the aircraft from the side:
 This visualisation can be used to help visually balance out the different forces that affect the aircraft pitch. In this simulation:
- the blue lines that cross the screen represent the airflow so you can visually see your incidence by comparing it to the white schematic of the aircraft.
- the green line on the wing schematic indicates the lift + drag forces acting on the wing
- the red line on the wing schematic indicates the gravity force and direction
- the blue line on the elevator schematic indicates the lift force on the elevator
The three line graph on the left is also used to represent the active roll (red), pitch(green) and yaw(blue) torques.
Radio Frequencies
 This window the frequencies of all the radio stations that are around the aircraft, and is designed to help debug radio related issues, and can also be used to find a radio station with the right features for your cockpit devices. It should be noted that radio detection works with callbacks which are generally triggered by the aircraft moving, so - if the window is empty when opened - you can press the
 Refresh to force an update or simply move the aircraft.
Sim
 These windows are used to show some "general" information about the simulation as well as activate certain overlays. This option acts as a quick way to enable the Sim Dimensions, Sim Info and Sim Forces overlays, since activating the Sim option will also show the overlays associated with those individual debug options.
In general, the graphic represents the following:
- Green: Lift coefficient vs AoA.
- Red: Drag coefficient vs AoA.
- Blue: \(C_m / {AoA}\) (pitch moment vs AoA).
- Other Colours: Roll and sideslip.
As well as activating those other overlays, this option will open a Sim Curves window with some values and a graph.
NOTE: This window is a work in progress and currently has little practical application.
Sim Dimensions

With this option you can enable the dimensions overlay which will show the approximate dimensions of the aircraft based on the values input in the Airplane Geometry section of The SimObject Editor. With this overlay you can see the fuselage "shell" in orange and the basic aircraft shape in white, and the Datum Reference Point is marked along with the Static Center Of Gravity Height. When this overlay is active, you will also be shown coloured lines that represent some of the forces acting upon the aircraft geometry. This overlay is also activated automatically if you enable the Sim option from the debug menu.
Sim Forces

With this overlay enabled, you can see a visual representation of the forces that are active on each of the "sample points" used by the flight model to determine how the aircraft flies. These sample points are shown with various lines and boxes where:
- Green rectangles are the "base" sample points which are positioned based on the parameters setup in the
flight_model.cfgfor the different surfaces (fuselage, wings, aileron, etc...). - Green lines are used to show the simulated surface angle along the Y-axis (the line is horizontal with the physical surface definition).
- Orange lines are used to show the simulated surface angle along the X-axis (the line is horizontal with the physical surface definition).
- Yellow lines show the surface normal where the line is always set at 90° to the surface plane.
- Red rectangles are used to illustrate the rigidity of the surface (so they may not line up perfectly with the sample points depending on the flexibility settings for that surface of the aircraft).
- Light blue lines that radiate from the sample points are force markers that are updated in real-time as you fly the aircraft and show a visual representation of the forces that are active on the surface, where the magnitude of the force is reflected by the length of the line.
- Dark blue lines
Note that this overlay is also activated if you enable the Sim option from the debug menu.
Sim Info
 This window shows some general information about the actual state of the simulation for the aircraft. The window is also shown automatically if you enable the Sim option from the debug menu.
Sim Polar Power
 When activated this option will open a Sim Curves window with a graph that plots various curves related to the engine power and speed, essentially allowing you to see how much power is required versus how much power you have.
WARNING! Activating this window will require Microsoft Flight Simulator 2024 to use a lot more processing power, and as such may lag the simulation.
Sim Polar VhVs
 When activated this option will open a Sim Curves window with a graph that plots curves related to the polar \(V_h\) and \(V_s\) values. This allows you to see how much height you lose when gliding and at what speed.
WARNING! Activating this window will require Microsoft Flight Simulator 2024 to use a lot more processing power, and as such may lag the simulation.
Sim Tuning
 This window lists a number of important parameters related to the aircraft that can be studied as the aircraft flies. This window will also open automatically when the
 [WEIGHT_AND_BALANCE] section is selected in The SimObject Editor.
Sim Wind Tunnel

This debug window provides an expanded set of information about the general aerodynamic characteristics of the current user aircraft, such as lift, drag, and their relationship with each other and their dependence on flight conditions. The information shown in this window is only applicable to the "Airplane" aircraft category (gliders included). With this tool, one can also obtain information about the current aircraft configuration - the state of flaps, slats, spoilers, and landing gear - and the flight conditions under which the "virtual wind tunnel" test is performed, as well as some set test conditions (aircraft configuration, flight conditions) different from the current ones in the simulation.
IMPORTANT! Obtaining the data from putting the aircraft into a "virtual wind tunnel" requires Microsoft Flight Simulator 2024 to use significantly more processing power than normal, which may cause the simulation to lag.
The window itself is split into three main sections:
- Actual State Of The Simulation - From here you can see the current aircraft configuration in use within the actual simulation outside of the "virtual wind tunnel". You may also set the weather conditions for the current state to "optimal", ie: with no high winds or air turbulence.
- Virtual Wind Tunnel Test Conditions - This section is used to set the state of the aircraft when placed in the virtual wind tunnel, with options to set the mach, slip, and AoA values, or simply go with the current simulation state values. Note that unchecking the Use Actual checkbox will enable additional configuration options, the type of which will depend on the parameters used in the aircraft design.
- Graphs - This section shows various graphs to better show the performance of the aircraft within the virtual wind tunnel. Each graph shows a different data set along with specific "points" related to important aircraft flight performance metrics: "Zero Lift point", "Minimum Drag point", "Maximum Lift point", and "Best Glide point". For each key point, the numerical values of /(C_l/), /(C_d/), Glide Ratio, Angle of Attack (AoA), and Angle of Sideslip (AoS) are now provided. All these key points are found by successive approximations with an accuracy of 0.001 degrees of Angle of Attack when performing the "virtual wind tunnel" test.
There is also an "Actual State point" with the same set of numerical data, which can optionally be displayed on all graphs at once. Unlike the other data points, this point is not obtained from the "virtual wind tunnel" test but represents the aircraft state in the current simulation. It is calculated based on the current total aerodynamic force acting on the aircraft and the instantaneous aircraft velocity vector at the center of aircraft, also taking into account the wind speed vector (for calculating current AoA, AoS, EAS, and Mach number). Since all these values are taken from the real-time simulation, this point represents what is actually happening in the simulation and may deviate from the curves obtained from the "virtual wind tunnel" test for a number of reasons:- the curves are calculated without taking the CFD into account (this is technical limitation).
- there may be a difference in Mach number and/or Angle of Slip and/or the Aircraft Configuration being used.
- the curves represent a non-rotating aircraft (i.e. it is tested in straight flight), so the actual airflow distribution is different when the aircraft is rotating/turning.
- there may also be a difference in the airflow distribution due to the turbulence presented in the simulation.
Speed
 This window lists a number of important parameters related to the speed at which the aircraft is flying, as well as some parameters that will affect how speed is calculated, the maximum speed, etc...
Stall
 This window shows information that can be used to debug and resolve issues related to the aircraft stall speeds and AoA.
Tracking
![]() This window shows a combination of common parameters that can be used to track the performance and behaviour of the aircraft along with the inputs used to affect those values. All values are shown on the left with their corresponding description, while the top right shows a graphic representation of the current inputs being received where:
This window shows a combination of common parameters that can be used to track the performance and behaviour of the aircraft along with the inputs used to affect those values. All values are shown on the left with their corresponding description, while the top right shows a graphic representation of the current inputs being received where:
- The white circle is the "raw" input, which will include curves and limits set in the input configuration.
- The green circles represent the actual end surface position including trim, elasticity, force limits, and reactivity delays. This may also include the position of the AP when the AP is controlling via trim or yoke.
- The red circles represents an intermediate surface position without trim but still including elasticity, force limits, and reactivity delays. This may also include the position of the AP when the AP is controlling via yoke.
- The central circles represents the ailerons.
- The bottom circles represents the rudder.
- The left circles represents the throttle position.
This window should be used once the aircraft is in flight and can be maneuvered.
Wear And Tear

Weight

This window can be used to display the different weight parameters as well as the parameters that affect the weight. At the same time, this option will show an overlay on the aircraft displaying all the parts of the aircraft that can be modified to affect the weight and balance, including the landing gear, the engine, the pilot and copilot, etc...

This window has the following options:
- Draw Aircraft Base Weight Data: When this is active, the display will show additional information in text format about the various areas that contribute to the aircraft weight.

- Draw Aircraft Base Weight Positions: When this is active, a number of boxes will be drawn to show the approximate positions of each item used to calculate the weight of the aircraft.
 The colours used here are:
- Green: General aircraft body
- Pink: Station loads
- Brown: Systems (usually fuel tanks)
- Red: Engines
- Yellow: Landing gear
- Draw Attached Objects Positions: When active, this will add boxes for attached objects that are contributing to the aircraft weight.
- Draw Registered Objects Positions: When enabled this will draw boxes to represent the system and core aircraft objects that are contributing to the weight.
The rest of this window is comprised of a number of expandable options that show various values derived from the setup of the aircraft and the current state of the simulation.
Wheels
 When you select this option, the debug wheels window will open and display information related to each of the wheels/landing gear defined for the aircraft. Enabling this option will also enable the wheels and contact points overlay:

In this overlay, each contact point (wheels are also considered as contact points) will be shown with a coloured square at the point of contact which has been defined for it in the aircraft parameters. Each point will also be projected along a white line onto the ground. The colours used are as follows:
- Green: Wheel
- Dark Blue: Scrape Point
 Black: Skid
 Light Blue: Float
 Cyan: Water Rudder
 Light Grey: Ski
- Orange: Propeller
This window and the overlay will also be automatically activated when you select the flight_model.cfg - [CONTACT POINTS] section in The SimObject Editor.
Related Topics