WASM DEBUG

The WASM Debug window is activated from the Debug menu and can be used get information about the different WASM modules that are currently loaded. When you first open the window you will need to select the module that should be displayed by choosing one from the Module drop-down list at the top of the window. Once one has been selected, the window will update to show additional information, as explained in the sections below.
Module Section
The Module Section tab gives you information on the module currently selected:
 Here you can see the Status of the module, which will be listed with one of the following messages:
- UNKNOWN: This should never appear and if it does then it means there is an unknown error with the module.
- COMPILING: The WASM file is being converted to a DLL.
- INITIALISING: The DLL has been created and it is being loaded.
- READY: The WASM module is loaded and ready to be used.
- FAILED: The compilation of the WASM to a DLL failed (you can look at the console to get more information).
- DIRTY: The WASM module was ready but an error occurred in the user's code (you can check the console to get more information). In this state, the WASM module won't be used.
After that you have the Is Encrypted status, which will be either true or false. If it's true, then there will be less information shown, as the encryption process makes certain things irrelevant. Below this - if the module isn't encrypted - you can see the Dll Path and then WASM Build Type and the DLL Build Type.
NOTE: If the DLL Build Type is set to Debug, it's because you have enabled WASM Debug Mode.
These should be the same and ideally be Release for a production package (mismatching build types will be flagged with an error message, as shown in the image below).

After the Build Type, we have the No Data Written At Address 0 message. When working with WASM, address 0 is a valid address so that means that a pointer value can be 0 and can be de-referenced without crashing (in contrast, if using C++ then de-referencing a nulltpr will cause a crash). So even if this is valid with WASM, it shouldn’t be made, and having some data at address 0 indicates an "error" in your code.
Experimental
The experimental section is for features that are part of the WASM debug module, but that are new and may not yet be stable or may change dramatically over time as they are improved/changed:

Currently this section is for testing the ability to Edit and Continue your module code, and it lets you recompile part of the currently selected WASM module while the project is actually running. For this section to be usable, the WASM build type and DLL build type must be set to DEBUG, not RELEASE. After making changes to your code, you can then click on the Recompile button to have the simulation recompile it and reload it. When you do this you will be shown some logs and popups that will tell you exactly what has happened, including whether the recompilation has been a success or a a failure, some descriptions of any issues, etc...
Using this feature, please keep in mind that:
- You can't update an existing type.
- You can't add a new member to a class, for example, but you can add new functions/methods.
- If you want to make a lot of changes, it is safer to make a clean new WASM module.
Gauges
The gauge section focus on the different gauges linked to the selected module:
 Here you will see listed the Registered WASM Gauges which is the number of gauges within the selected module that have been registered as available. Beneath this you are shown the Total Execution Time Per Update, which is a constantly updating value showing the time (in microseconds) that the module requires to update.
The last part of this section is used for selecting a specific gauge from the WASM module to have more information displayed about it. The list of gauges shown here is built up from the panel.cfg file. For example, consider this image:
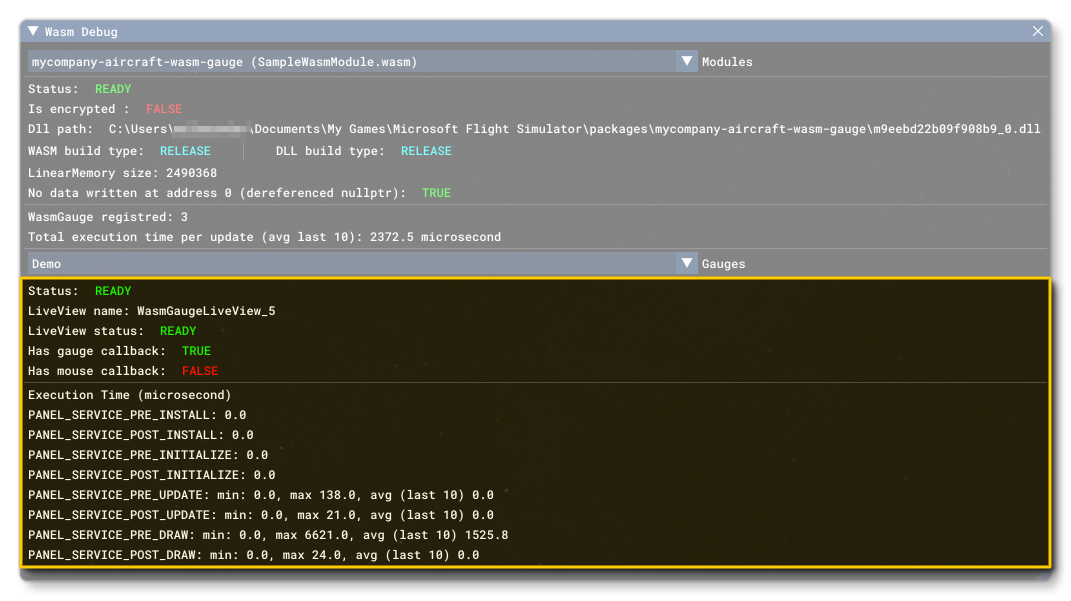 Here we're inspecting the "Demo" gauge, This was defined in the
 panel.cfg file like this:
htmlgauge00=WasmInstrument/WasmInstrument.html?wasm_module=SampleWasmModule.wasm&wasm_gauge=Demo, 0,0,1024,768
It is worth noting that some additional, custom parameters can be added to this definition. One of the things this permits you to do is have multiple gauges that use the same name, but have different parameter values. For example:
htmlgauge00=WasmInstrument/WasmInstrument.html?wasm_module=SampleWasmModule.wasm&wasm_gauge=Demo, 0,0,1024,768
htmlgauge00=WasmInstrument/WasmInstrument.html?wasm_module=SampleWasmModule.wasm&wasm_gauge=Demo, 0,0,1024,768, Param1
htmlgauge01=WasmInstrument/WasmInstrument.html?wasm_module=SampleWasmModule.wasm&wasm_gauge=Demo, 0,0,1024,768, Param2
When the CFG file is set up like this the parameter values will be displayed after the name in the list.
Gauge Status
Once a gauge has been selected from the drop-down list, you will be presented with information on the status of the gauge:

The different status messages you can have are:
- UNKNOWN: This should never appear and if it does then it means there is an unknown error with the gauge (and probably the module).
- LOADING: The gauge is being loaded.
- READY: The gauge is ready to be used.
- FAILED: Something has happened that has caused the gauge to fail and not work.
Next you're shown the Liveview Name which is the name of the Coherent liveview, and you'll also be shown the Liveview Status which will be one of the following:
- IDLE
- LOADING
- READY
- OBSOLETE
Finally you have two boolean identifiers to tell you if it Has Gauge Callback or Has Mouse Callback.
Execution Times
This final section shows the computed the execution times for the selected gauge each time that gauge callback is called as an itemised list that breaks down the individual events that are called each frame:

Note that if this window is opened after a flight has started, then the execution times may read 0.0 or be inaccurate, since some of the times are only computed once when the gauge is initialised. Restarting the flight with this window open will show the correct values.
Memory Debug
This tab contains information related to how the selected module is using the available memory:

At the top of this tab you have a section giving an overview of the memory that allocation and size. It has the following option:
- Update Memory Data Frequency: This controls the polling frequency for the tab. While this tab is focused, data about the module's memory use will be gathered each "n" frames, where "n" is the value given in this input field.
The rest of this section has the following information:
- Linear Memory Size - This shows the total size of virtual memory given to the module.
- Heap Memory - This shows the size of heap memory for the module, along with the real committed memory for the heap (i.e: the physical memory that is used for the heap). The Heap Memory is a part of the Linear Memory.
- Allocated - This shows the part of the memory that has been allocated (i.e: containing data). Allocated Memory is a part of the Heap Memory.
- Not Allocated - This shows the memory that can be allocated with a
malloc. The Not Allocated Memory is a part of the Heap Memory. - Released - This shows the memory which has been given back to the system, there is no physical memory bound to it. The Released Memory is a part of the Not Allocated Memory.
- Wasted Memory - This shows the memory which is not used by the module, but is bound to physical memory. There are multiple sources of wasted memory, some are due to the system (unallocated pages not decommited, system data, etc…), others are caused by the memory fragmentation (pages with very little data). The rest of the Memory Debug tab can help to track this. Wasted Memory is part of the Not Allocated Memory.
- Data And Stack Memory - This shows the memory available to stack and static data. The Data And Stack Memory is part of the Linear Memory.
Under this data you have the Full Check Memory button. Clicking this will check if the internal memory data is correct and memory allocation is working as it should. If you click this and get any message other than "Memory Is Okay", then broken memory pages will be listed further down and - if located in the heap - they will also be printed in the memory fragmentation window. You should contact DevSupport in the case of errors.
Memory Fragmentation Grid
The memory fragmentation grid contains a representation of how Heap Memory is allocated, where each grid cell is a WASM memory page:

There are five possible states that a page can have:
 (grey): The page is currently de-committed (there is no physical memory bound to it).
 (green): The page is committed (there is physical memory bound to it), but it currently contains no data. This page may be de-committed soon, except if this is the last block (In which case, the page will never be de-committed).
 (red): The page is committed (there is physical memory bound to it), the page contains data, and is currently full.
 (blue): The page is committed (there is physical memory bound to it), the page contains data, but it is not currently full.
 (magenta): The page not in a valid state. You can hover over the square - and/or click on it - to show more info, and if you have pages like this then you should contact DevSupport.
If you hover over any of the page squares, you will be shown further data about the page state, including:
- An ID value to identify the page.
- How much memory is malloced on the page.
- The number of chunks that start on the page. A chunk is the result of one malloc, and the number shown includes the number of free chunks.
- The number of free chunks that start on the page. A free chunk is the result of a malloc and then a free.
If you click on any of the page squares then you can get even more information about the page state, which is shown in the window under the Memory Fragmentation Grid:

This section repeats the information that can be found by hovering and also includes:
- The start address, which is the memory location where the page starts
- A list of details about the each chunk which includes:
- an ID
- the memory address
- the size
- whether the chunk is in use or not
Note that you can click on the address or the size to copy the value to the clipboard.
Decommit Duration
At the bottom of the Memory Debug tab, you can find the Decommit Duration:

This section shows the time taken to decommit a page, giving the last decommit time along with minimum, maximum and average values. If you are experimenting any lag spikes when using the module, you can use this section to determine whether the issue is with the decommit process or not. Note that the simulation should decommit unused WASM pages automatically to prevent memory leaks and having all the available memory filled up by the module.