DEBUG

This menu controls a number of different simulator and developer mode options to help with creating your add-on content. The options available to you from this menu are listed below.
-
Console
This will open the Developer Mode output Console. This window displays information about the current state of the engine and of Developer Mode. For more information see the page on The Console.
Debug Drawing
-
Sim Objects
Selecting this will open the SimObject Containers window, where you can view general information and debug the various SimObjects in the current simulation scene. For more information, see SimObject Containers.
-
Sim Object Model Statistics
Selecting this option will open the SimObject Stats window, where you can view very detailed information on the models and bitmaps used to render the different SimObjects in the simulation. For more information, see SimObject Stats.
-
World Objects
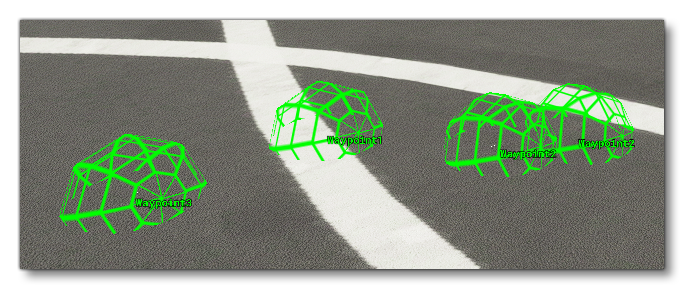
This option will show certain debug information for world objects and markers in the simulation. You'll get "spheres" (spherical meshes) to show data like waypoints and also overlay text.
-
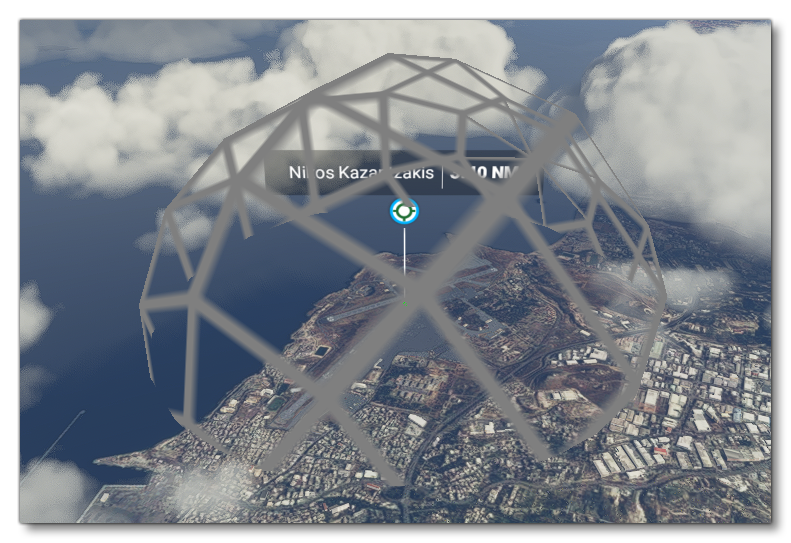
POI
Selecting this option will show POI (Points of interest) with "spheres" (spherical meshes) in the simulation.
-
Collisions
When you hover over this option you will be presented with the following two checkboxes:
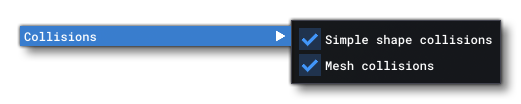 Selecting either (or both) of these will add debug drawing for the Simple Shape Collisions and for the Mesh Collisions of the different scenery and simulation objects (including the user aircraft):
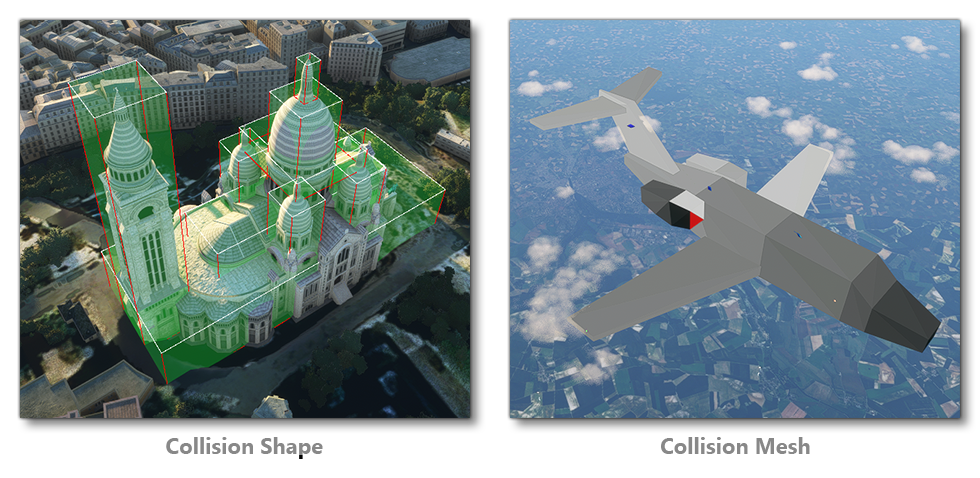 Note that the Mesh Collision checkbox will also render the Cockpit DRONE_COLLISION_IN mesh. Also note that if collisions are disabled in the engine for an object that has a collision shape, then the bounding boxes will be rendered using dashed lines.
-
Flight Object Debug
Enabling this option when within a flight or a mission will show the main Flight Object Debug window: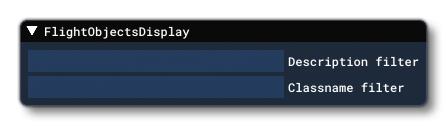 And may also show different sub-windows, eg:
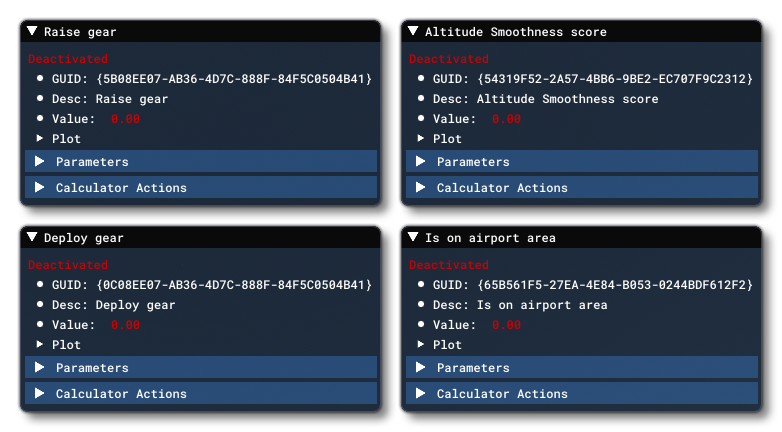 This tool is for debugging the different mission calculators when in a flight, and each sub-window will display the internal logic for the different calculators available. These sub-windows can be filtered from the main window using the following input fields:
- Description Filter: filters the sub-windows based on the description field in the calculator.
- Classname Filter: filters the sub-windows based on the classname of the calculator.
-
Aircraft
This option opens a sub-menu where you can access the various debug windows that are used to debug the performance of the current aircraft being flown. You can find all the information about these windows from the following section: Aircraft Debug Menu
-
Airports
This option opens a sub-menu where you can enable airport debugging. For more information on the options in this sub-menu please see here.
-
Terrain
This option opens a sub-menu where you can enable airport debugging. For more information on the options in this sub-menu please see here.
Rendering
-
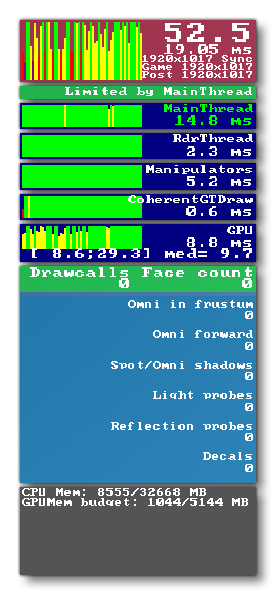
Display FPS
Enabling this option will show the current FPS of the simulator as well ass some additional performance related debug information.
-
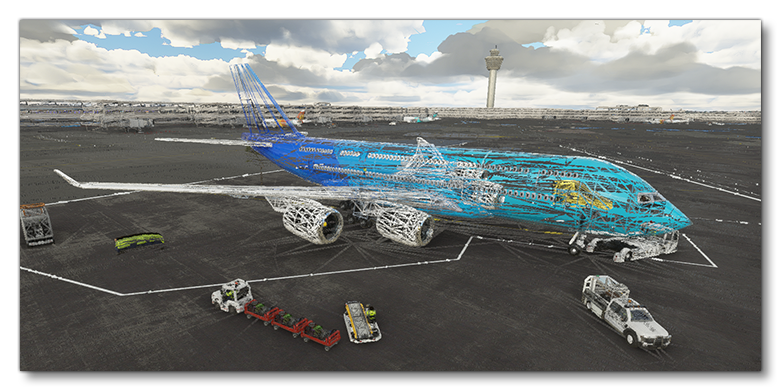
Wireframe
This enables the wireframe view of the simulation, where all models are rendered as wireframe meshes.
-
Display Position
Selecting this will open the Position window:
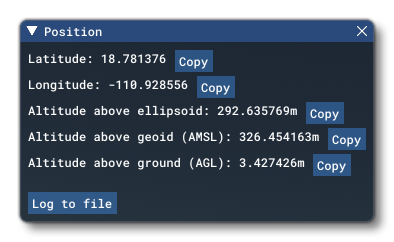 This shows the position of the current selected aircraft within the world. Each individual positional value can be copied to the clipboard using the Copy button, or you can click the Log to file button to open a file explorer window and save out a text file with all of the data. Note that if you save the file you will also have to add the extension as part of the file name, for example "
Position.txt".
-
Debug Model LODs
Enabling this option will open the Debug LODs window where you have multiple options to show the LODs and LOD-related data overlaid on the simulation. For full information on the options present in this window, please see the Debug LODs section.
WASM
-
Display WASM Debug Window
Enabling this option will show the WASM Debug window, explained in more detail here: WASM Debug
Experimental
IMPORTANT! Features placed in this section are those which may - or may not - become final features of the SDK. Using these features is done at your own risk as they may impact the stability of the simulation and DevMode tools.
NOTE: Previously this menu showed these options:
- Use NanoVG for XML Gauges
- Enable Replay Panel
These options were moved to the in-simulation options menu, and as such are now documented here: Experimental Features.
-
Debug Weather
Selecting this option will open the Debug Weather Sim window, which is described in full on the following page:
-
Debug Vegetation
When enabled, this option will open a new window with debug information related to the drawing of vegetation in the scene: This window has all the data that is related to the vegetation rendering, and is directly affected by the two in-sim options for Terrain Level Of Detail and Tree density:
  Both these options will affect how the vegetation is rendered along with the values that the debug window displays. You can also visualise the difference these options make by enabling the Show Vegetation In Red option, which will then shade all the vegetation bright red and permit you to better visualise the impact of the different detail options, as shown in the image below:
