BEHAVIORS DEBUG
The Behavior Debug window can be opened from the Debug menu when Developer Mode is active, and the simulation is running (ie: a flight has been started). The window looks like this:
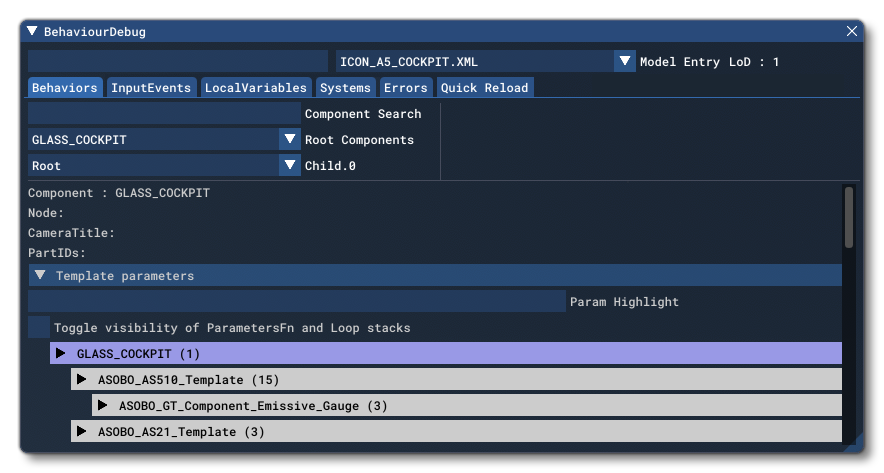
This window is used primarily for debugging the different aspects of the <Behaviors> XML element for an aircraft. At the top of the window you have two options, one is an input window which can be used to filter the contents of the XML file, and the other is to select the Model Entry XML file to view (normally either an interior or an exterior file, although you will be presented with a list of all simulation objects currently in the scene to choose from). Note that the LOD for the model is also displayed, and that for the exterior model of the user aircraft this will always be LOD 0 by default, although you can change this behavior using the Force User LOD 0 option from the Debug LODs window.
The available tabs under these two filter options are explained in the sections below.
Behaviors
The Behaviors tab can be used to analyse the hierarchy of the components and templates used to define the different behaviors of the model XML currently being examined, as well as various different sections of data (the sections visible will depend on what root component is selected).
The top section of the main window contains the following options:
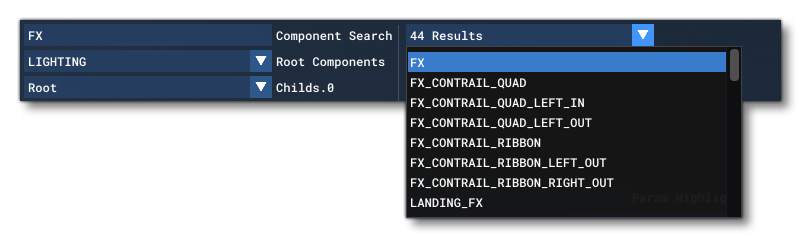
- Component Search: Here you can search for a specific component from with the different Root Components and their Child components. The number of search results will be shown on the right, and you can click this to expand a list of components and select one:
- Root Component: This menu lets you select one of the "root" components from the model being explored. This will change the templates being shown as well as the kind of data sections available.
- Child.N: This menu permits you to select a child component to explore. The contents of this list will depend on the Root Component, and if there are no child components then only "root" will be available. Note that any particular Root Component may have more than one set of Child components, in which case they will be listed one under the other, where N is used to identify the child, for example: Child.0, Child.1, Child.2, etc...
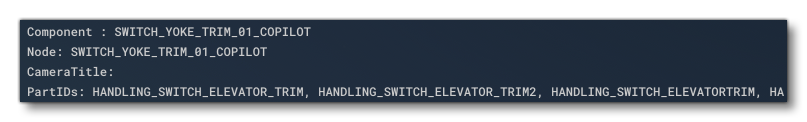
Below these options you have some details that will change and update based on the Root Component and Child that has been selected:
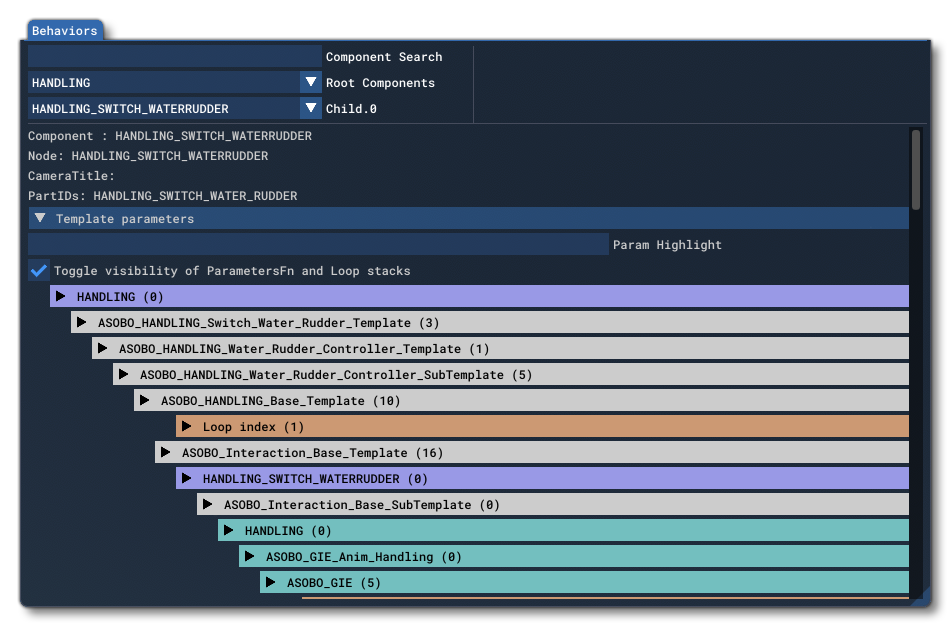
The rest of the window will be taken up with the template hierarchy, and you can click on any of the template nodes to expand the template and see what elements have been set for the object (the value beside the node shows how many elements it contains):
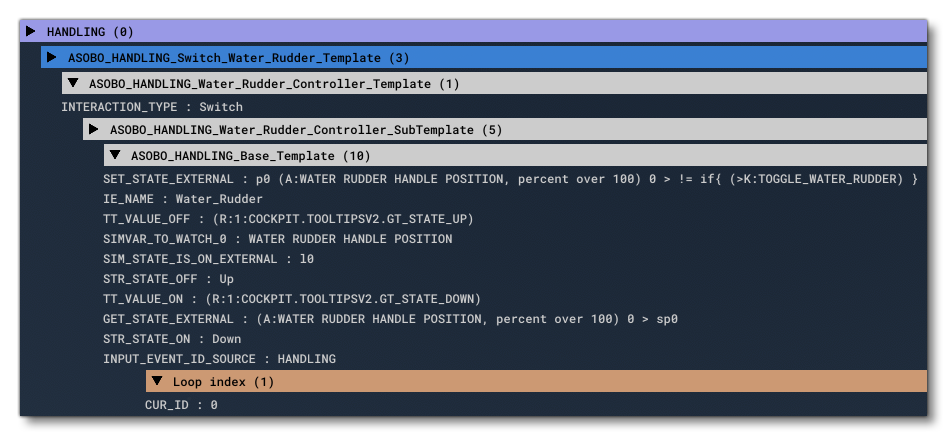
This template hierarchy is colour coded in the following way:
- Blue: components
- White: templates
- Cyan: input event extend
- Light Cyan: input event preset
- Orange: functions and loops (only visible when Toggle Visibility Of ParametersFn And Loop Stacks is checked)
- Yellow: return parameters
- Dark Yellow: internal parameter function parameters
- Gray: all the scoped parameters defined within the template
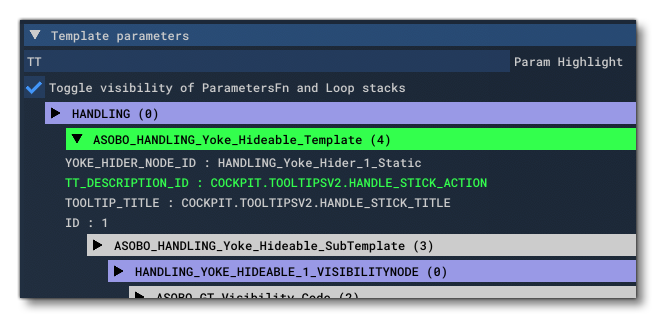
Note that you can quickly find any parameter element within one or more templates by using the Param Highlight input field, which will highlight the templates with any parameter containing the input string in their name. The templates will be highlighted in bright green, and within the template the parameters that contain the input string will be highlighted green too:
Underneath the hierarchy view of the templates you can find additional information about the model behaviour which is color coded using the following scheme:
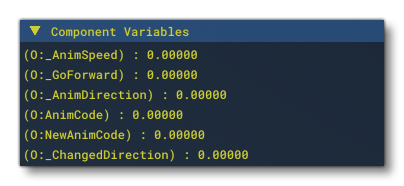
- Yellow : Component Variables - This section shows the different Component/Root Component variables:
- Red : Anim N - This section is for the the animations associated with the model:
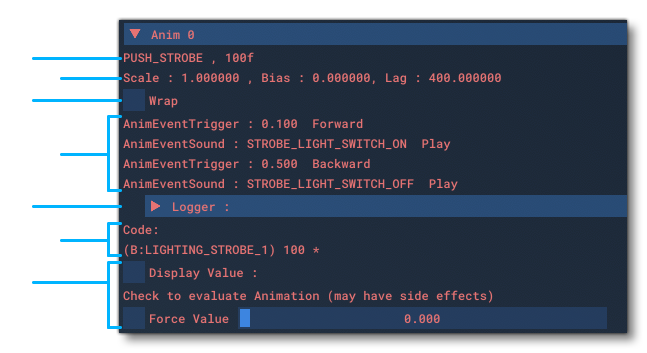 The actual information shown here will vary depending on the animation but will generally include the following (from top to bottom):
- The name and number of frames for the animation
- The Scale, Bias, and Lag values (Lag is essentially how much the animation will be "smoothed" as it changes position)
- Whether the animation Wraps or not (ie: if it is 100 frames and the position is set to frame 100, it will go to frame 0 and the same in reverse).
- Any event Triggers for the animation, showing at what Percent Over 100 the trigger will occur and whether the trigger should only happen if the animation position is being incremented, decremented or both. Underneath is the Event Effect showing what event is going to be triggered.
- This is the input logger which can be used to see the exact details of input for the animation (and other things). For more information see the Logger section, below.
- Here you can see the code that governs the animation.
- When you check the Display Value checkbox you are requesting that the XML code is evaluated and the results displayed. Note that using this option may have side-effects as it could potentially be calling Keys or setting variables. You may also check the Force value checkbox then use the slider to the side to force a value as the output.
- Red : Material N - For materials the section will look like this:
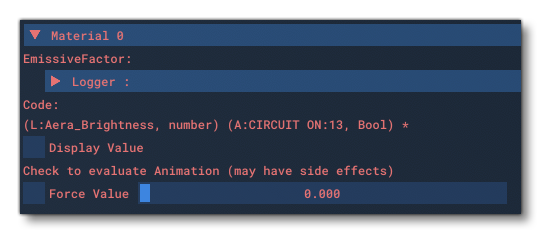 At the top you have the Emissive Factor and then the Logger. Under that you have the Code section where you can click the Display Value option to show the value that the code evaluates to. Note that using this option may have side-effects as it could potentially be calling Keys or setting variables. You may also check the Force value checkbox then use the slider to the side to force a value as the output.
- Purple : Update - This section is for update information related to the model:
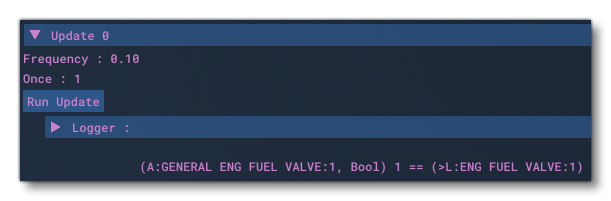 It shows the Frequency that the update event happens which is calculated as how often the update happens per second so a value of 1 is an update of once per second, a value of 2 would be once per second, etc... You also have the Once flag value, which - if set to 1 (true) - means that the update will open happen once in the object lifetime, in which case there will be an additional
 Run Updatebutton where you can force an update. You will also find the Logger here and underneath that the code that runs when the update is called.
- Light Blue : MouseRect - This section is for the various MouseRects used for interaction in the aircraft interior:
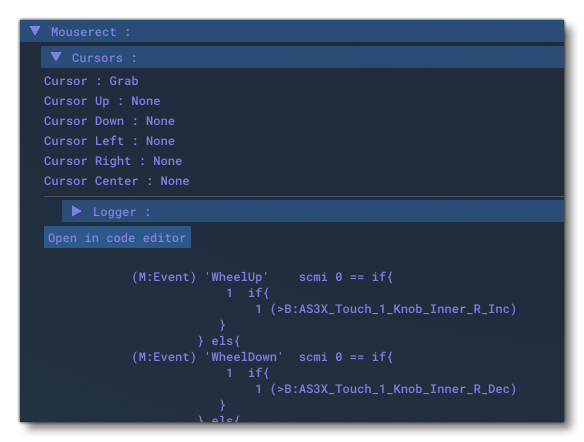 The top of this section shows the Cursors that are used for interactions with the mouserect. Next you have the Logger and after that the code for the interaction, which can be edited in real time through the Code Editor which can be opened by clicking the
 Open In Code Editorbutton. Note that there may be an additional Tooltip section - particularly if it is a legacy aircraft - with information on the tooltip that will be displayed for the interaction.
- Light Green : Visibility - This section is related to component visibility and looks like this:
 Here you have the Logger and after that the code for the visibility controls, with the option to Display Value.
- Cyan : Effect N - If the section is for a visual effect, it will look like this:
 As with other elements, here you can see the Logger section, and under that the GUID of the effect, then the Code along with the Minimum Emission Time. Again, you also have the Display Value option to evaluate the code.
Additionally, you may see listed in the Behaviors tab a section for Input Event Presets. This section is purely informative and designed to let you know that an input event has been associated for the current component. You can click the Go To Input Event button to be taken to the InputEvents tab which will open on the relevant preset.
InputEvents
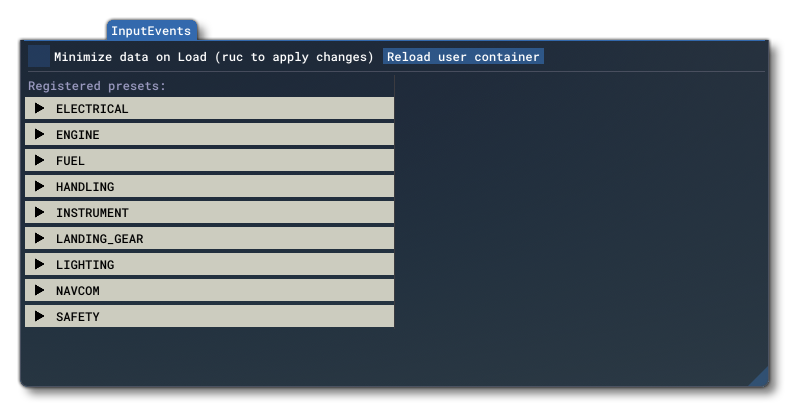 The InputEvents tab of the Behaviors debug window can be used to revise and edit the different Input Event Presets for an aircraft. The information shown here is only available when the Model Entry at the top of the window has been set to the interior aircraft XML, and will show the different input presets that have been registered on the left, and on the right you have the Control Panel where different information will be shown about very specific values from within the different presets.
The registered presets can be expanded by clicking on them to show available preset sections, and each section can be expanded to show the contents of the preset. In the image below, the Electrical section has been expanded and within that the preset ELECTRICAL_Battery_1 is shown:
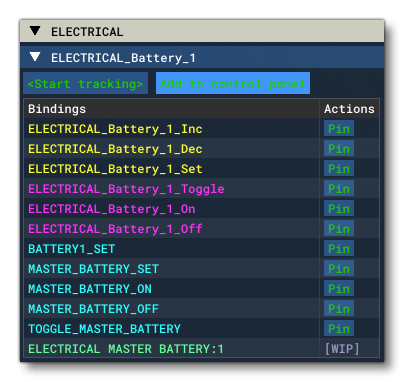
For each preset, some or all of the following items will be show, coded by color:
- Yellow: The default input event registers,
<Inc>(increment),Dec(decrement) and<Set>. - Purple: These are registers specific to the preset being examined and are not part of the defaults.
- Light Blue: These are the different Key Events that are being intercepted by the preset.
- Light Green: This is the SimVar that is being watched and that forces the
<Init>to run when it is modified.
Most of these items can be Pinned by clicking the Pin button. This will add them to the Control Panel:
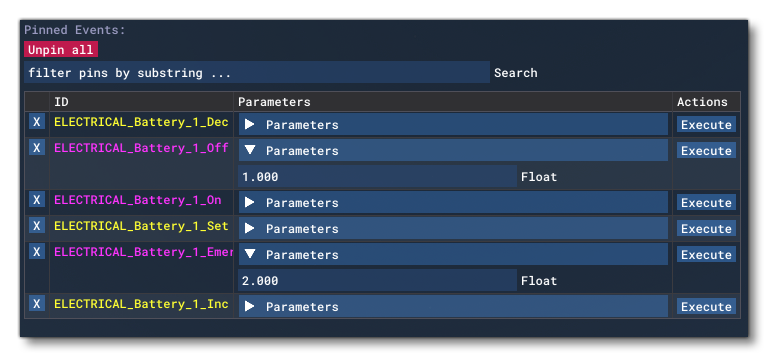 Pinned events can be expanded to show the paramter values associated with them, and you can click the
 Execute button to execute the event to test it. You can also remove an event at any time by clicking the X button beside it, or clear all pinned events fromt he Control Panel by clicking the Unpin All button. When you have multiple events pinned, these can be filtered using the Search input box at the top.
Above the information shown for each registered preset you can also find the following two buttons:
Start Tracking: This will add the preset to the Control Panel to be tracked:
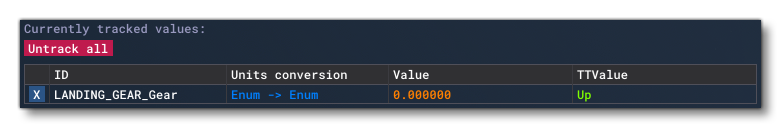 You can track multiple presets in this way and they will all be listed in the Control Panel on the right of the main debug window. Note that once you have three or more tracked presets you will have an additional input at the top to filter the tracked values, and that you may remove a tracked value by clicking the
 Xbutton beside it, or you can remove all tracked values clicking theUntrack Allbutton. Also note that the "Units Conversion" section can be modified from the preset by giving a different unit in the Units field:
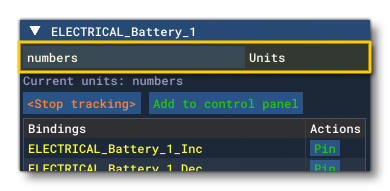 From this field you can choose the output units, which should be one of those listed here: Simulation Variable Units.
Add To Control Panel: This adds the preset to the Control Panel for code editing:
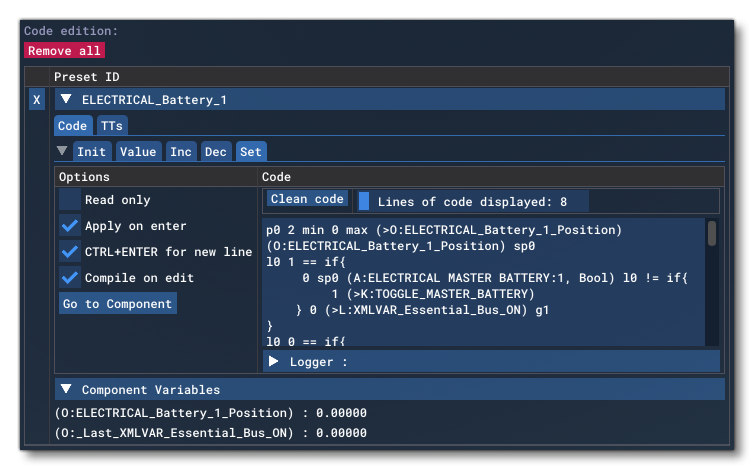 From here you can edit different sections of
 Codefrom the Init, Value, Inc, Dec and Set tabs, and each one corresponds to the same section of the Input Event preset. This is done using the same code editor as used by Behaviors (which is explained here: Code Editor) and the section also contains Logger information. If you select theTTstab at the top instead of theCodetab, then the editor will present you with tabs corresponding to the tooltip code for the preset: TTDescription, TTValue and Other Data. Note that at anytime you can click the Go to Component button to be taken the Behaviors component that has the input event in it. You may also remove the preset from the Control Panel by clicking theXbutton, or you can remove all presets by clicking on theRemove Allbutton.
LocalVariables
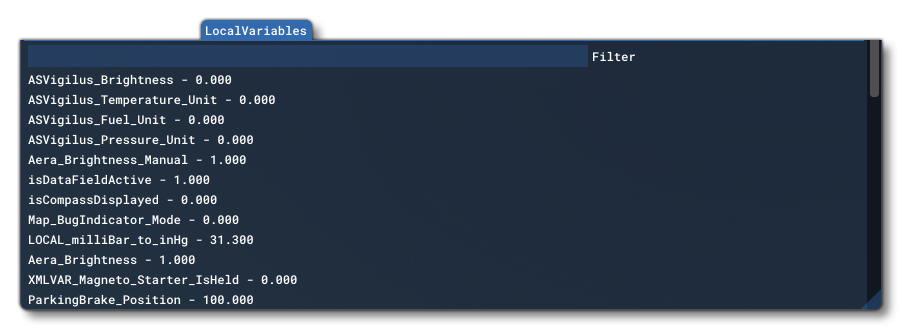 On this tab you can find a list of all the different local variables used by the various component templates in the mode l behaviors, along with the value that each one can hold (expressed as a float). You can click on any of the listed variables, and you will be presented with an input field where you can change the value. Note that any changes may not be persistent as the values may be reset by the aircraft code as the simulation runs. You can also filter the list to help find a variable using the "Filter" input field at the top. This is important as the variables listed in this window are for all the aircraft that you have installed, since they are all parsed and compiled when Microsoft Flight Simulator 2020 first starts.
Systems
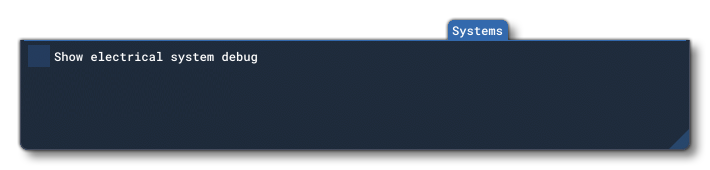 This tab permits you to debug electrical systems. Selecting the Show Electrical System Debug option will open the Electrical System Debug window, which is split into the following three tabs:
Components Overview

From this tab you can see all the different components that make up the electrical system in your aircraft. The information shown here cannot be edited, but is provided to give you an overview of the system while it's in use so you can trace issues and errors more easily. The circuits are color coded to allow you to quickly see where the issues are:
- Green circuits are powered
- Gray circuits are shut down
- Red circuits are enabled but are not receiving sufficient power/voltage to function.
In general, a red circuit should be investigated.
Note that each item (Circuits, Batteries, etc...) can be searched using the Search input field at the top of the relevant section.
Bus Connections

On this tab you can find all the information related to the different components and their bus connections. The components are colour coded to make it easier to identify what is being connected, and you can use the Bus Filter option at the top to narrow the information down to those buses that you wish to observe. You may also change the amount of visible information for any one bus by editing the Height value.
Procedures

On the Procedures tab you can see any of the electrical procedures that have been set up for the aircraft electrical system. On this tab you can set the assigned procedures to be inversed or not, where the checkbox will be checked if they are, and unchecked if they are not (if checked then the procedure boolean values will be inverted when executing the procedure. For example, if the procedure has the action SetCir:5,0, it will then become SetCir:5,1). You may also test the procedure here by having them execute when you press the Exec button.
Errors
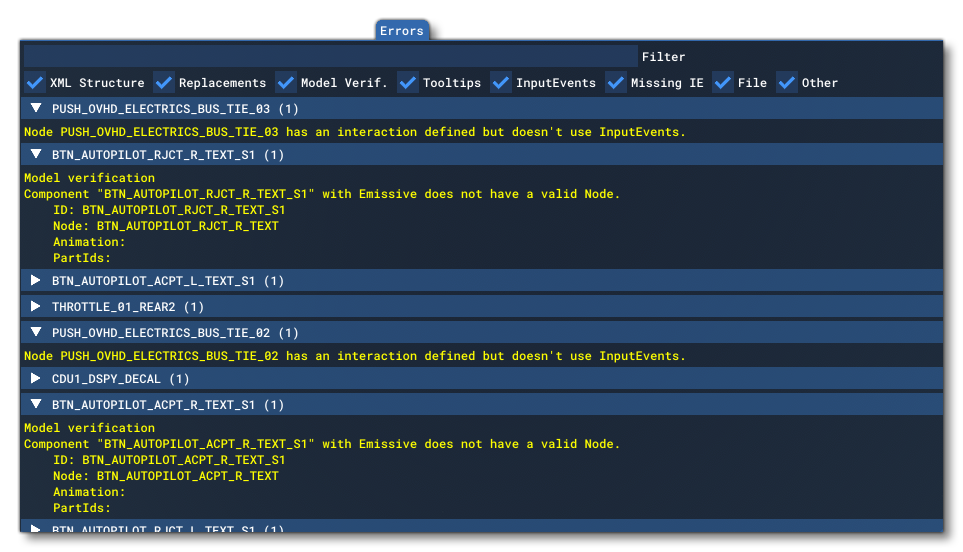 This tab will show up any errors that have been detected within the various XML files that make up the model behaviors for the currently selected object. At the top is an input field that can be used to filter the list of errors, and there are a number of check-boxes that you use to show or hide specific types of error. These check-boxes are:
- XML Structure: This filter is for anything to do with the structure of the XML file. For example, the XML is invalid in some way, like it has an opening element but no closing element, or an element expects an attribute and doesn't find it.
- Replacement: This filter is for anything to do with errors within the parameters and macros.
- Model Verif.: This filter is for checking that the animation/nodes being used actually exist and that the component that requires a node - i.e: a component with an interaction - has one.
- Tooltips: This filter will show any error related to tooltips.
- InputEvents: This filter will show any error related to Input Events.
- Missing IE: This filter is used to show or hide those components with an interaction that don't use ">B:". Essentially filtering interactions that do not call InputEvents.
- File: This filter is for anything to do with file loading (generally "Includes").
- Other: THis filter is for anything else that isn't covered by the other filters.
Quick Reload
This is a button that will rebuild the package of the currently selected aircraft and also reload the "user container". The user container is essentially all the data in memory associated with the current aircraft and location within the simulation, along with other assorted meta-data.
Logger
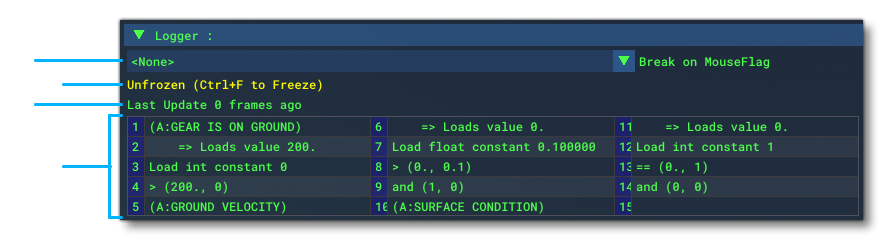
This section is present in multiple parts of the Behaviors Debug window and is used to log the code used within a specific component. In every circumstance where the logger is present it has the following parts:
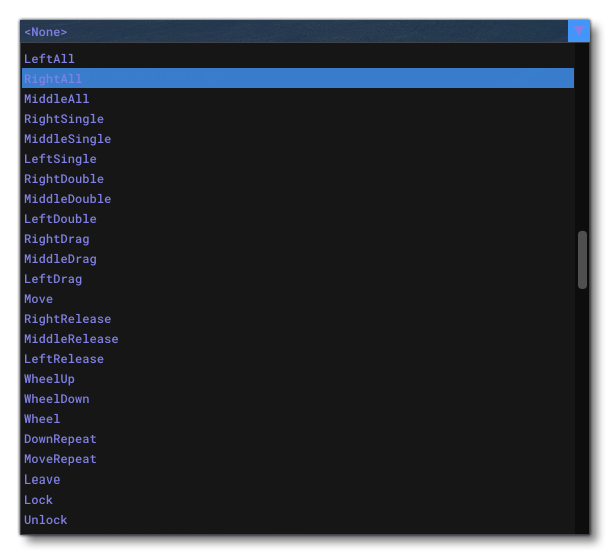
- This option - Break on MouseFlag - permits you to freeze the interaction exactly at the moment when a particular interaction is detected, which can be any of the following:
- This shows whether the mouserect interaction is either frozen or unfrozen. A frozen interaction is one that will not progress until it is unfrozen, permitting you to analyse the status and data for the interaction. You can freeze/unfreeze using the keyboard shortcut
CTRL + F, or use the Break On MouseFlag option to freeze on a specific mouse interaction. - Tells you how many frames have passed since the last time the mouserect detected an interaction.
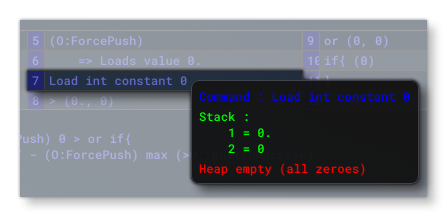
- The table shows you the steps that have been performed by the XML code for the interaction. Hovering the mouse over any of the table entries will show you the state of the registers and the call stack:
Code Editor
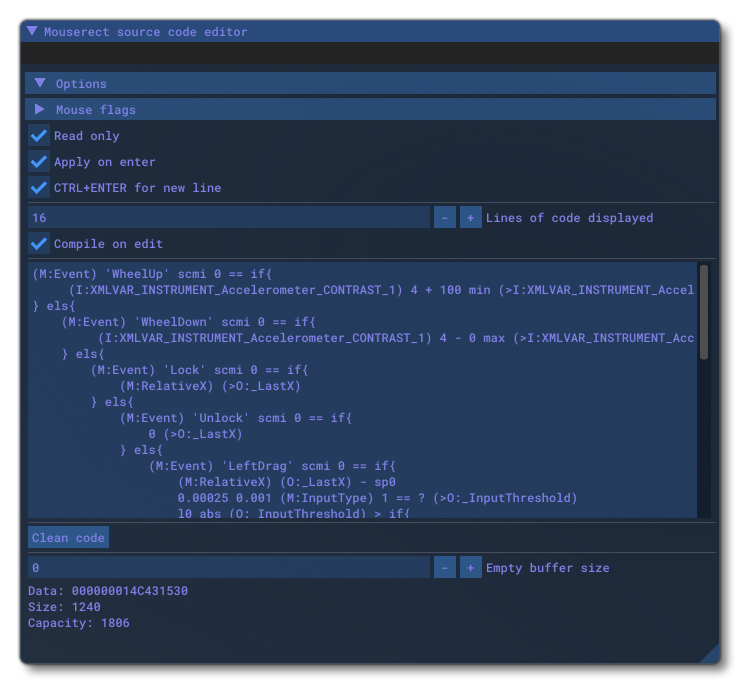
The code editor is opened by clicking on the Open In Code Editor button from the MouseRect sections of the Behaviors tab. This editor permits you to see and edit the code that is used by the mouserect input in real-time so you can make changes and see the effect that it has. The editor has the following Options:
- Mouse Flags: Permits you to see and edit the mouse inputs that are used for the mouserect to react to.
- Read Only: When this is checked, the code cannot be edited and is in "read only" mode. Un-checking this means that you can edit the code in real-time.
- Apply On Enter: When this is checked, changes to the code will be applied to the mouserect XML on pressing the
ENTERkey. If you have also enabled Compile On Edit, then the changes will be compiled and can be tested in the simulation. - CTRL+ENTER For New Line: When this is checked you can use
CTRL+ENTERto generate a new line in the editor. - Lines Of Code Displayed: This input permits you customise the number of lines of code that will be visible within editor. You can input an amount directly or use the
+/-buttons to increment / decrement the line number by 8 each time. - Compile On Edit: When this is enabled, any changes you make and apply will be compiled into the aircraft, so they can be tested within the simulation.
Below the options you have the editor window itself, which s a basic text editor that shows the code currently being modified. Underneath the editor you have the Clean Code button which will automatically tidy up the formatting of the code for you.