RECTANGLE OBJECTS
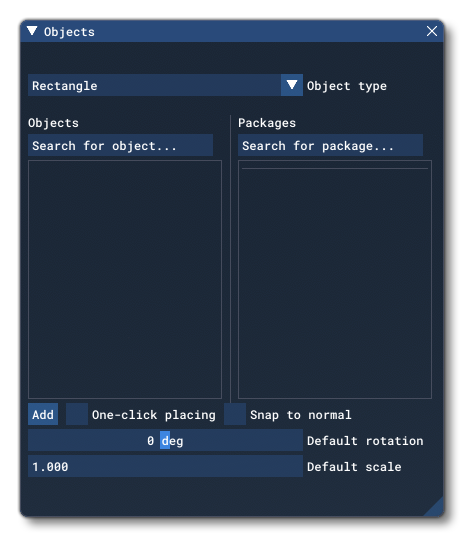
NOTE: This object is not available when the Scenery Editor is in World Hub Mode.A Rectangle object is an object element used to define a rectangular area specifically for terraforming a rectangular area. When you select this object type the Objects window will not show any different object elements as currently there is only one type of rectangle and what it does is defined through its :
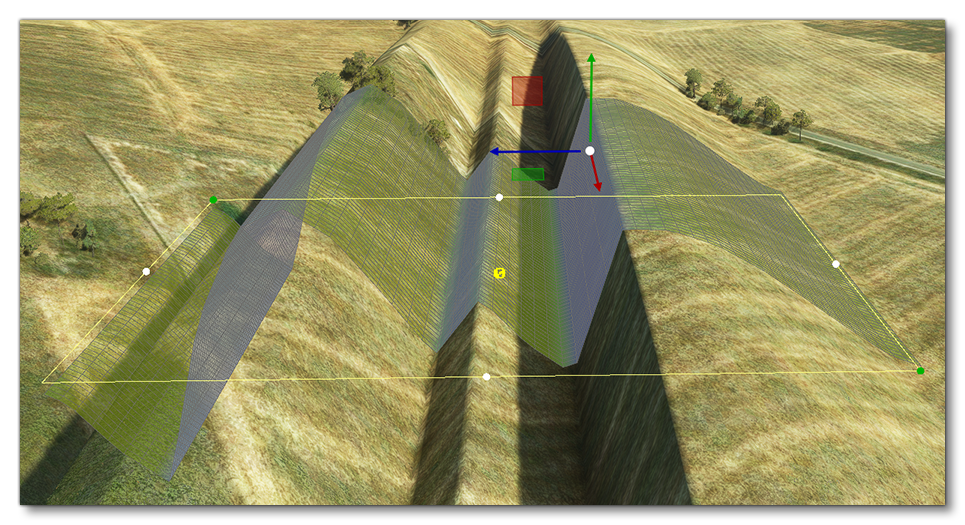
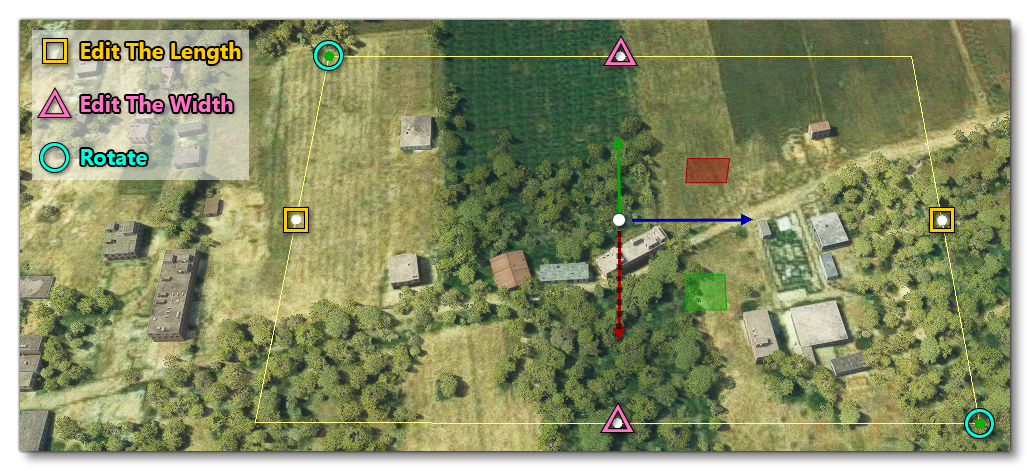
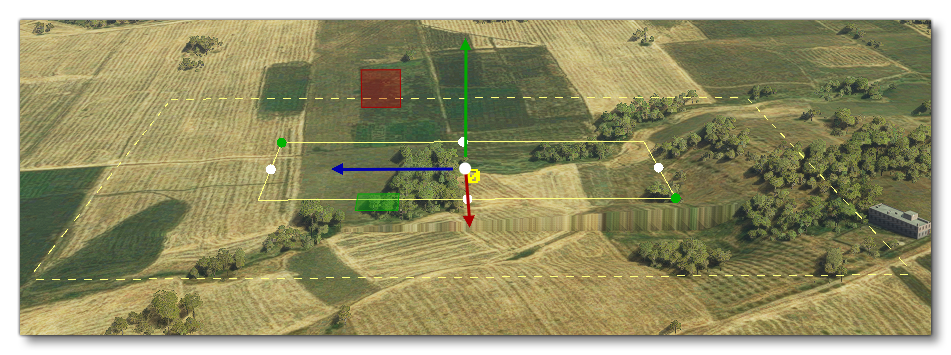
When you select a rectangle object and click Add, the rectangle will be added to the scene and you can edit its size (length / width) through the Properties window or using the Gizmo in its center. The gizmo can also be used to change the scale and rotation of the rectangle. You'll notice that there are various points shown on the rectangle area in the world. Each of these points can also be clicked on, which will move the gizmo to that point and enable you to edit the following properties:
 Once you are happy with the placement of the rectangle, you can then go on to edit its Properties. Note that if you wish to remove the rectangle, you can select it and press
 Delete on the keyboard.
IMPORTANT! If you load a previously created scenery project into DevMode, it is possible that you will be asked if you want to convert terraforming to the "new" system. This is a permanent change and cannot be undone, so if you are happy with the way your terraforming looks, you should select Cancel. For more information, please see here: Old Terraforming Method 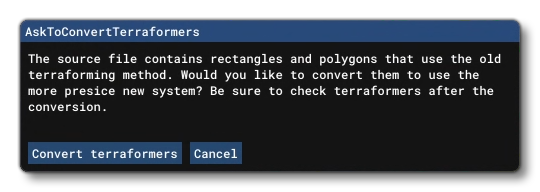
Properties
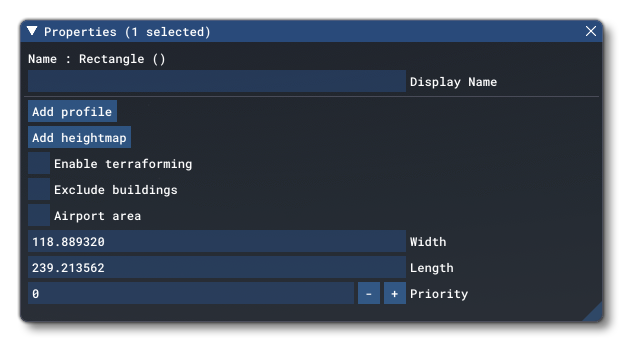
Rectangle objects have the following Properties which can be edited:
-
Name
This is the name of the element as defined from its properties. For example if you have selected the Enable Terraform option, the name would become "Rectangle (terraform)".
-
Display Name
This is the name of the element as it will be displayed in the The Scenery Contents List. This can be edited and is helpful for identifying elements when you have a lot of items in the content list.
-
Add Profile / Show Profile Editor
The
Add Profile/Show Profile Editorbutton will open the Profile Editor which can be used to sculpt the terrain in and around the rectangle object element.
-
Add Heightmap
The button will open extra options permitting you to create a custom heightmap for the terrain within the rectangle object element. This editor is explained in the Editing Heightmaps section, below.
-
Enable Terraforming
This option can be used to enable or disable terraforming. When enabled, without changing any other properties, the rectangle area will be flattened and you will be presented with a new option:
- Falloff Distance: This sets the distance around the rectangle which will be "feathered", smoothing the difference in altitude between the rectangle terraformer and the surrounding terrain. This is shown in the scene as a dashed line, and the value is in meters.
 IMPORTANT! When stacking terraforming rectangles, the falloff will only be used for the lowest priority rectangle. All rectangles on top will have their falloff behave as if it was set to 0 and so give the sharpest transition possible
Note that this option will be enabled automatically when you create a terrain Profile or add a Heightmap, and disabling the option will also disable any profiles or heightmaps that you have created (although they will not be deleted and enabling the option again will show them).
- Falloff Distance: This sets the distance around the rectangle which will be "feathered", smoothing the difference in altitude between the rectangle terraformer and the surrounding terrain. This is shown in the scene as a dashed line, and the value is in meters.
-
Exclude Buildings
When this option is enabled, any building that are within the rectangle area will be excluded. This includes:
- Detected Buildings - These are buildings created algorithmically from the aerial image data.
- OSM Buildings - These are buildings created from the data supplied by Open Street Maps.
- MS Buildings - These are buildings generated from open-source data for North America that comes from Microsoft.
-
Airport Area
This option tells the simulation that the rectangle area is part of an airport. Selecting this option will affect how some of the buildings are rendered in the world within the rectangle.
-
Width / Length
These input fields permit you to precisely set the width and length of the rectangle object element. Values are in meters and will be updated automatically if you change the width and length using the gizmo a the scene.
-
Priority
This option sets the render priority for the rectangle. The default render priority is 0, which for most cases is fine. However, if you have overlapping rectangles and want one to render over another one, then you will need to change this value clicking the
+or-buttons to raise or lower the priority value. Higher priority values will render over lower priorities, for example, a rectangle with priority 1 will render over one with priority 0, which in turn will render over one with priority -1. Note that we cannot guarantee the render order for rectangles with the same priority, so if you need something to render over or under something else, you need to set this value. Note that if the rectangle is flagged as terraforming then the priority value will be rendered in the world view to make debugging easier.
Profile Editor
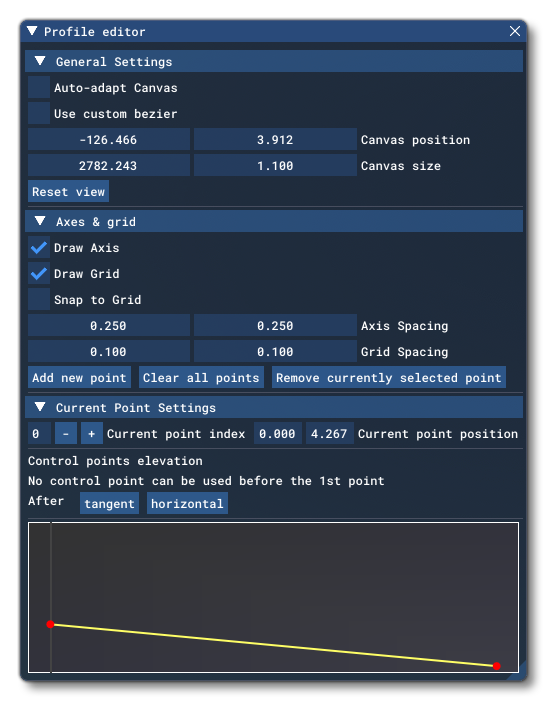
The Profile Editor will be opened the first time you click the Add Profile button in the rectangle object window (this button will then change to Show Profile Editor - unless you delete the profile - even if you make no changes):
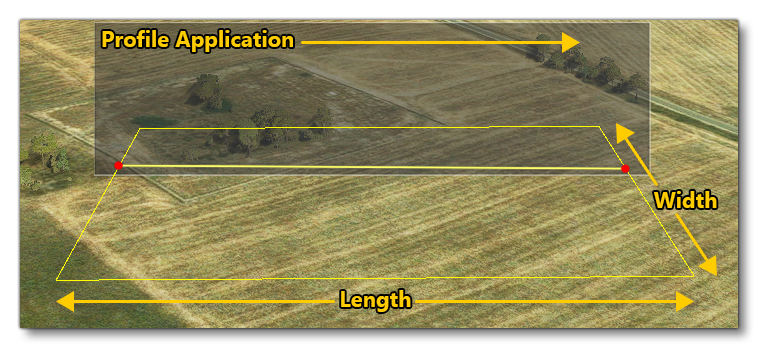
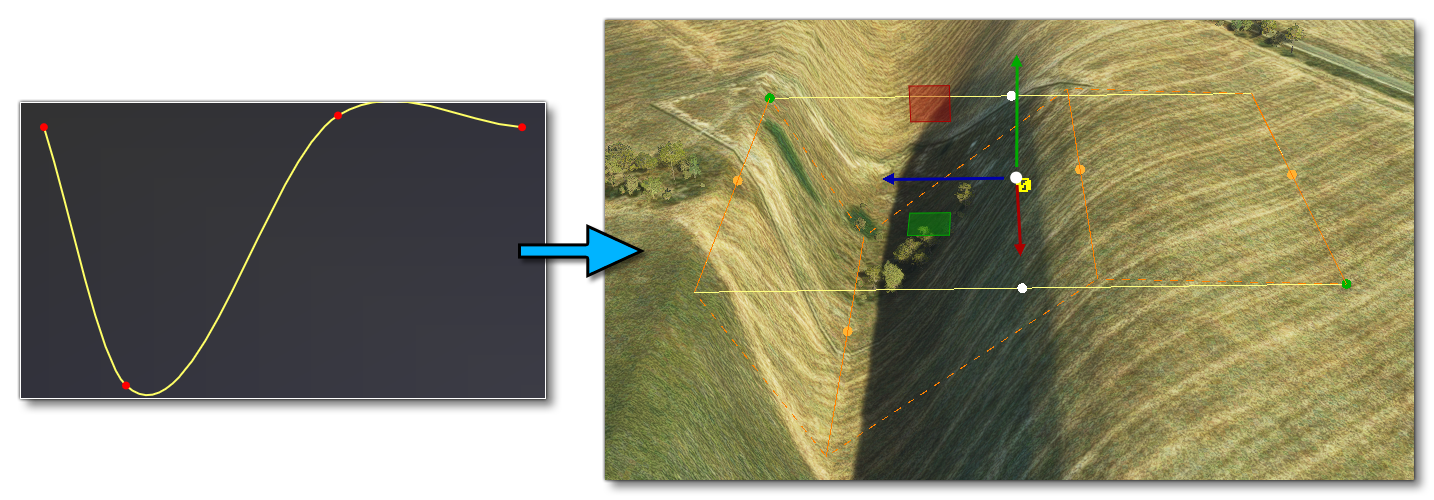
A terrain profile is basically a series of points along a line that mark different heights along the length of the rectangle, where length is defined from left to right as you view the rectangle when it's first been added to the world:
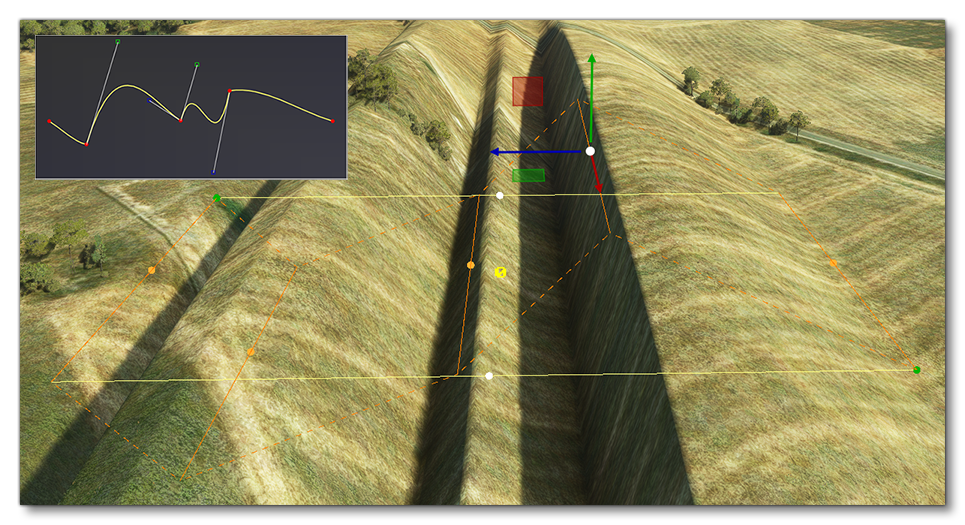
When you start to edit the profile, these changes will be reflected in the simulation, and additional information will be displayed using orange lines. There will also be additional "handles" (points) that can be clicked and edited using the Gizmo. This gives you a more visual way of editing the profile which may be easier than adding points on a graph or directly editing values:
To add a point into the profile, simply click the Add New Point button, then go to the canvas at the bottom and click (the canvas is the area at the bottom of the screen that contains a graphic representation of the profile). Alternatively, you can hold down the Shift key and click anywhere within the graph. Either method will add a point at the mouse position, which can then be edited in one of three ways:
- In the world using the points gizmo (as explained above)
- By clicking on the point and dragging it around
- By editing the values in the Current Point Settings
Points can be removed by selecting the point then clicking the Remove Currently Selected Point button (under the Current Point Settings section), and you can also use the Clear All Points button to remove all points from the profile - this will also remove the profile from the rectangle and close the editor.
NOTE: You cannot remove the first or last point on the profile, and they can only be edited along the Y axis of the profile canvas (ie: you can only set the altitude of those points and not the position).
It is important to note that you cannot use profiles at the same time as a heightmap. Doing so will show an error in the Scenery Editor window, and the rectangle object will be listed in red:
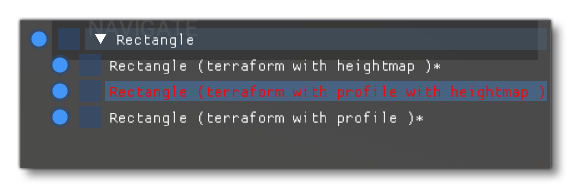
You should use only one of these systems to generate terraforming data, although you can translate a profile into a heightmap (explained in the Heightmap section, below).
The sections below cover the rest of the functionality within this editor.
General Settings
- Auto-adapt Canvas: Selecting this option will automatically resize the profile canvas as you drag or change the position of the points. When this is enabled, neither the Canvas Size nor the Canvas Position fields can be edited.
- Use Custom Bezier: This enables an alternative way of rendering the profile curves that may or may not give a better result than the default method.
- Canvas Position: When the Auto-adapt Canvas option is disabled, this can be use used to set the X/Y position of the view within the canvas. These values will update automatically when Auto-adapt Canvas is enabled.
- Canvas Size: When the Auto-adapt Canvas option is disabled, this can be use used to set the size (width/height) of the view within the canvas. These values will update automatically when Auto-adapt Canvas is enabled.
- Reset View: Clicking this button will reset the canvas position and size back to their default values.
Axes And Grid
- Draw Axis: When enabled, the X/Y axis will be drawn for reference in the canvas view.
- Draw Grid: When enabled, a grid will be drawn over the canvas. This is purely a visual reference, unless you also enable the Snap To Grid option, in which case points on the profile will snap to the grid positions.
- Snap To Grid: When enabled, any points added to the profile or any points being edited within the profile, will be snapped to the grid. This option is independent of whether Draw Grid is enabled or not, and you can set the grid resolution using the Grid Spacing inputs.
- Axis Spacing: Changes the spacing on the X/Y axis in the canvas.
- Grid Spacing: Changes the X/Y resolution of the canvas grid. Editing these values will affect how points are added or edited when the Snap To Grid option is enabled.
Current Point Settings
- Current Point Index: The index of the current point in the profile being changed. Note that index values start at 0.
- Current Point Position: The X/Y position of the point in the canvas. These values will update automatically if you move the point in the canvas, or edit the profile using the gizmos in the simulation. You can also manually input values into these fields.
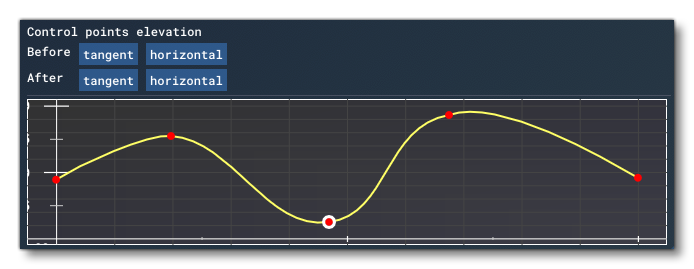
Canvas
The canvas is the section at the bottom where you can add and edit points on the profile. As you select points you will see additional buttons that can be used to add bezier "handles" to the point enabling you to change the way previous/later points connect:
Clicking the tangent button will add a bezier handle at a tangent to the control point, while using the horizontal button will add the handle along the horizontal (X) axis. These handles can then be clicked on and dragged to generate different forms within the profile:
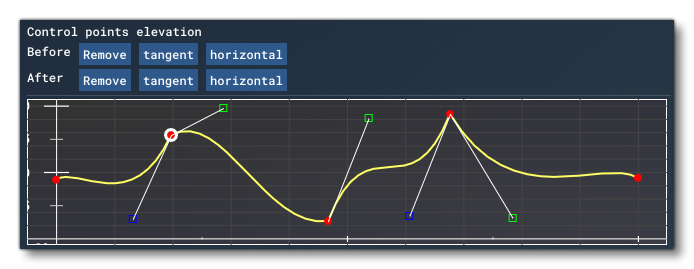
You can also remove these handles to go back to the default interpolation between points by selecting a point and clicking on the remove button.
Editing Heightmaps
A heightmap is essentially a grid (called a mesh) that is layered over the terrain where each cell in the grid is attributed an altitude (height) value. The heightmap is generated using the mouse cursor as a "brush" to define the height of irregular areas of the terrain when the left mouse button is clicked, and how the brush does this will depend on the size and type of brush being used. Heightmaps can also be generated from profiles, which is explained at the bottom of this page.
When you click on the Add Heightmap button in the Properties window for the rectangle object, you will be presented with the following options:
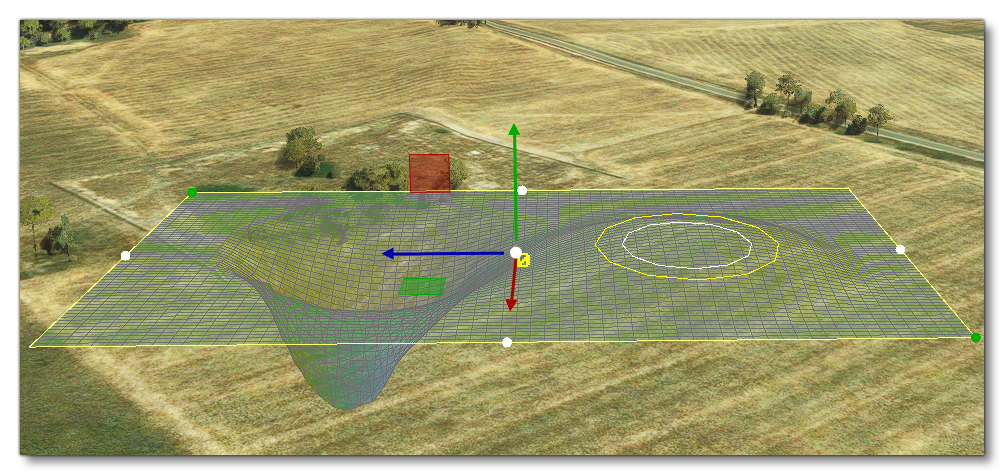
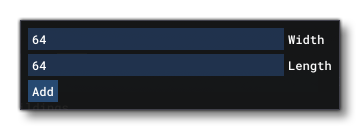 Here you can set the resolution of the heightmap mesh along the width and height of the rectangle, and clicking the
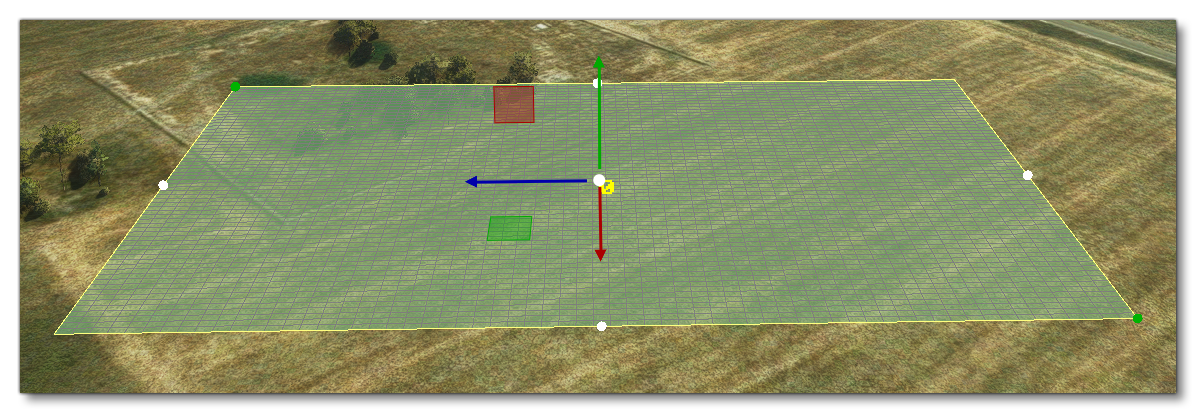
 Add button will add the heightmap to the rectangle and the mesh be visible in the scene for you to edit. Within the world, the rectangle will now look like this:
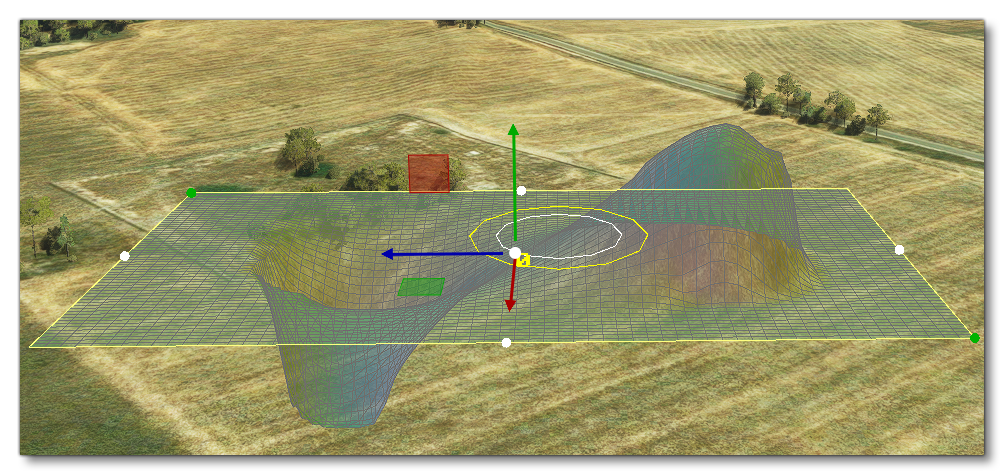
 At this point you would want to enable the Edit Heightmap option in the Properties window, which will add a "brush" to the cursor in the world view, and also open up the following options:
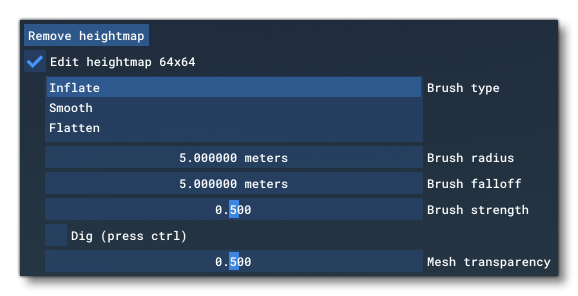
- Brush Type: Here you can select the type of brush that will be used to modify the terrain when the left mouse button is clicked. The three brush types are:
- Inflate - This brush "inflate" the terrain and raise the heightmap cells under the brush, or - if the Dig modifier is selected using the
Ctrlkey - it will "deflate" the terrain and lower the heightmap cells.
- Smooth - This brush will attempt to smooth the heightmap cells where the brush is used. Smoothing simply tries to even out any gradients between cells of different altitudes, so you could - for example - create a mound using the Inflate brush, then convert it into a soft hill using the Smooth brush around the edges.
- Flatten - This brush will flatten all heightmap cells within the brush radius back down towards the same level as the initial terrain height.
- Inflate - This brush "inflate" the terrain and raise the heightmap cells under the brush, or - if the Dig modifier is selected using the
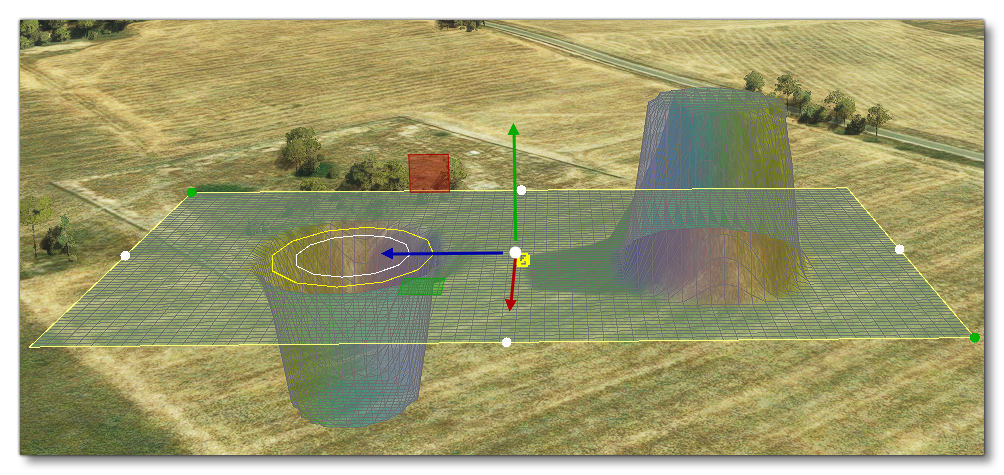
- Brush Radius: This is the radius in meters of the brush being used to sculpt the terrain. In the scene, it is the white circle around the cursor position.
- Brush Falloff: This is the falloff distance around the brush for smoothing the transition between the base mesh and the sculpted mesh. In the scene, it is the yellow circle around the cursor position.
- Brush Strength: This sets the strength of the brush. The higher the value, the more extreme the effect the brush will have on the heightmap.
- Dig: This is only for use with the Inflate brush and will convert the brush into a "deflate" brush, lowering the terrain height. It is activated automatically when you hold down the
Ctrlkey.
- Mesh Transparency: This sets the visual transparency of the heightmap mesh (grid) overlay in the scene. It is a purely visual feature for helping to see how the terrain is being manipulated.
Creating A Heightmap From A Profile
When editing terrain using a rectangle object element, it is only possible to use either a heightmap or a profile, but you can't use both at once. However, you can convert a profile into a heightmap (but not the reverse given that a heightmap is non-linear). To do this, you must first create the profile using the Profile Editor, as explained in the section above.
Once you have the profile in the editor, click the button Add Heightmap and set up the heightmap mesh properties then click Add, keeping the Profile Editor open. This will add a heightmap to the rectangle. The Scenery Editor will show an error at this point, as you cannot have both a heightmap and a profile active at once, so - to resolve this and convert the profile into a heightmap - simply click the Clear All Points button in the Profile Editor. This will erase all the profile points and remove it from the rectangle, leaving the height data from the profile as part of the heightmap mesh, which can now be edited as normal using the inflate/smooth/flatten brushes: