ECS / PNEUMATIC SYSTEM DEBUG
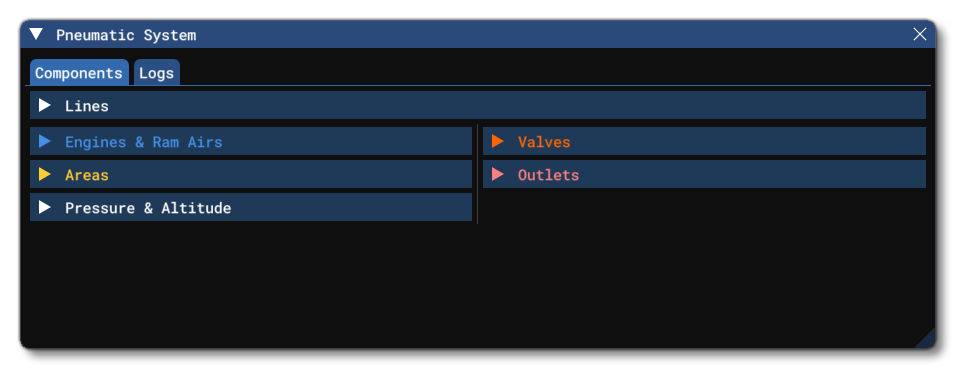
The ECS / Pneumatic System debug window is opened from the Debug menu of the Behaviors Debug window or from the SimObject Debug Menu itself. From this window you can get an overview of the components that make up the Modular Pneumatics System, as well as debug and edit them.
Note that in addition to this debug window, there will be messages logged in the Console which will signal problems, warnings, and changes as they are detected by the simulation. The console can be filtered using the Message group filter to show only the pneumatic system output, making it easier to find the corresponding messages:

Components
This tab has a number of sections that represent the different components that make up the pneumatic system of the aircraft, as well as an additional section related to general pressure and altitude data. Note that the sections listed on this tab will change depending on the aircraft setup, only showing those that are relevant to the components used in the pneumatic system.
Lines

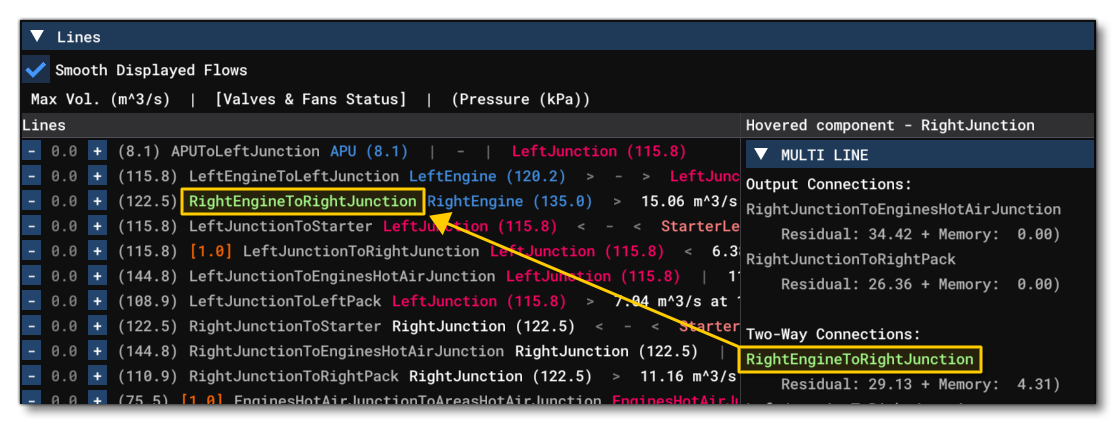
This section shows all the information related to the different Line definitions for the aircraft. At the top of this section, there is an option to Smooth Displayed Flows, which - when checked - will interpolate the values for the lines, helping to make the display more readable (since without smoothing the values will jump around every frame, causing the display to flicker).
The main section is split into two halves, where on the left we have the lines, and on the right we have detailed information about any particular line selected by the mouse hovering over it. Each line shows the following information:
- Flow: The first value is the flow for the line, in m³ per second, which can be modified using the
-/+buttons (note that any changes here will not be saved and are purely for debugging and testing). - Maximum Volume: This is the value in brackets for the line and shows the maximum flow for the line, in m³ per second.
- Valve / Fan Status: Where applicable, the valve / fan status will be shown as an orange value between 0 (off/closed) and 1 (open/on).
- Line Name: The name of the line component.
- Source Component: The name of the source component.
- Line Data: The volume, pressure and temperature of the air flow coming from the source component and into the line (if applicable). Note that if the line is not a non-return line, it can also be the volume, pressure and temperature of the air flow coming from the destination component into the line.
- Destination Component: The name of the destination component.
To help make this list more readable and easy to follow at a glance, the "flow" between the source, line, and output, is signified using special characters, where ">" or "<" means that the air is flowing in that direction and "|" means that currently air cannot go in that direction (usually because a valve is closed). All the components have also been colour coded, as follows:
- Blue: engines and ram air intakes
- Purple: packs
- Cyan: mixer units
- Yellow: areas
- Pink: outlets
- Orange: valves
- Magenta: junctions
- Gray: lines
The right part of the Lines section displays information about the last component that the mouse was hovering over, and the line - or lines - it is connected to. The information shown will depend on the number of connecting lines as well as the component itself, but generally you will be shown the line information at the top, and the component information at the bottom, along with things like input energy, temperature, pressure, etc... It is worth noting that if you pass the mouse over any of the lines, they will be highlighted bright green in the lines list.
Engines And Ram Air Intakes

This section shows all the information related to the different APU, Engine, and RamAir, definitions for the aircraft. The information is split into two categories (note that any changes to the editable options will not be saved and are purely for debugging and testing):
- Engines / APUs: These sections show the name of the engine / APU as well as it's current RPM, and under that information you have the option to toggle on or off the bleed air. You also have the various output values, of which you can edit the Flow and Temperature, and the debug window values will update in real-time to show the effect that these changes will have.
- Ram Air: This section is dedicated to the ram air intakes of the aircraft, and has multiple data points you can check including the intake flow, pressure and temperature. Additionally you can modify the input surface area of the intake and the debug window values will update in real-time to show the effect that this change will have.
Packs

This section shows all the information related to the different Pack definitions for the aircraft. The top of this section has a global control to use default temperature output for the listed packs. The Toggle button is used to enable / disable this on the packs listed below. If it is enabled then the default temperature slider will be visible, otherwise it will be hidden.
Each individual pack has the following information / options (note that any changes to the editable options will not be saved and are purely for debugging and testing):
- Name - This shows the name of the pack and also has a
Togglebutton to toggle the pack on or off. Note that this toggle is not an override for the simulation state. For example, toggling the pack on when it has no power in the simulation, will not switch the pack on as it is not powered. - Switch - This shows whether the pack is switched on or not.
- Power - This shows whether the pack is powered or not.
- Auto Mode - This is used to toggle on / off the pack auto-flow mode. If auto-flow is disabled, an override of the pack flow will appear next to the check box (as shown in the image above for the right pack).
- Default Temperature Output - This shows the default temperature output for the pack. The slider can be moved to modify the value.
- Min Temperature Output - This shows the minimum temperature that can be output for the pack. The slider can be moved to modify the value.
- Max temperature Output - This shows the maximum temperature that can be output for the pack. The slider can be moved to modify the value.
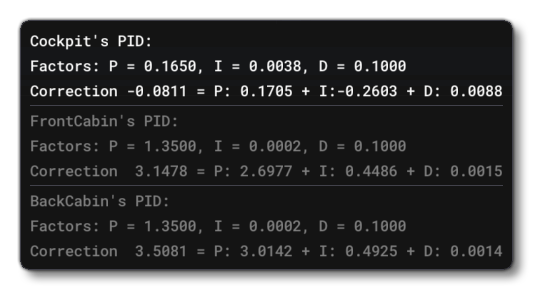
- PID Output - This shows the output of the PID that is used to govern the final temperature output of the pack. You can see the internal P, I and D values by hovering over the
(?)beside the option (note that these can be edited from the Areas section).
Areas
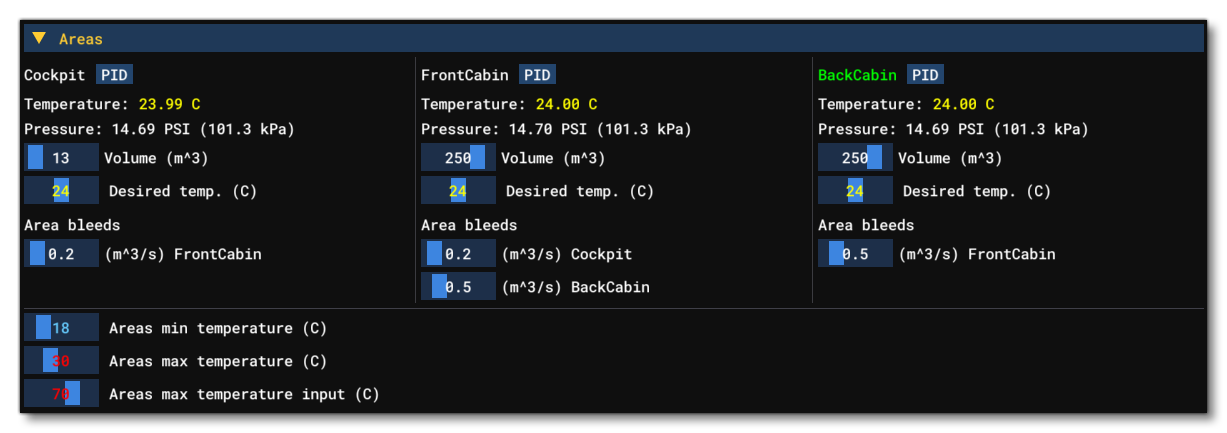
This section shows all the information related to the different Area definitions for the aircraft. At the top of this window you will find all the different areas that have been defined in the CFG file, and each one has the following options / information (note that any changes to the editable options will not be saved and are purely for debugging and testing):
- Name: This shows the name of the area, along with a button labelled
PID. Clicking the button lets you change the proportional, integral, and derivative terms. You can see how these changes impact the simulation from the Packs section. - Temperature: Shows the current temperature for the area.
- Pressure: Shows the current pressure for the area.
- Volume: Shows the volume that the area encompasses, and this can be edited in real-time using the slider.
- Desired Temperature: Shows the target temperature for the area, and this can be edited in real-time using the slider.
- Area Bleeds: In this section you will see the different areas that the current one "bleeds" into, along with the rate of bleed per second into that area. Each bleed area has a slider which can be used to change the bleed rate.
Under all the areas you can find three editable global values that are used to set general minimum and maximum temperatures for all areas, as well as the maximum input temperature. Each of these has a slider which can be used to change the temperature.
Valves

This section shows all the information related to the different Valve definitions for the aircraft. Each line is a single valve and shows the following options / information (note that any changes to the editable options will not be saved and are purely for debugging and testing):
- Toggle: This will toggle the valve status between open and closed.
- Valve Target Status: This shows the current status value for the valve. The slider can be used to change the amount the valve is open or closed. Note that a value of zero will always flag the valve status as closed, and any value over 0 is open. If you edit this value, an additional button -
R- will be available, and clicking this will reset the valve status to the value it should have at this moment. - Name: This shows the name of the valve, as defined in the CFG file.
- PID: If the valve mode is set to "AUTO" then a PID will be associated with the valve which is used to control it's status. Clicking the
PIDbutton will open a sub-window where you can edit the the proportional, integral, and derivative terms. - Status: The current valve status, either OPEN or CLOSED.
- Circuit: The Circuit that controls power to the valve.
- Mode: This is the current valve control mode, which can be either AUTO, MANUAL, OPEN, or CLOSED. The slider can be used to switch between the different valve modes, but note that some aircraft will only maintain this change for one frame before returning to the state defined in the package (this will depend on the model behaviors of the aircraft).
Fans

This section shows all the information related to the different Fan definitions for the aircraft. Each line is a single fan and shows the following options / information (note that any changes to the editable options will not be saved and are purely for debugging and testing):
- Toggle: This will toggle the fan status between on and off.
- Fan Target Status: This shows the target fan speed as a Percent Over 100, and you can drag the slider to modify this.
- Name: This shows the name of the fan, as defined in the CFG file.
- Status: This shows the status of the fan (either off or on) as well as the percentage speed.
- Pressure: When a fan is on, this shows the current pressure from the fan in psi.
- Static Pressure: This shows the fan static pressure in kilopascals. You can edit the value here to debug and test different static pressure settings.
- Max Flow: This shows the maximum airflow for the fan. You can edit the value here to debug and test different flow settings.
Junctions

This section shows all the information related to the different Junction definitions for the aircraft. Each junction is listed in it's own section and shows all the lines coming into it or going out of it. The lines are shown as either in, out, or 2way, in which case the line is bi-directional. The value shown in brackets beside each line is the current pressure, in kilopascals. If the line is shown in white then it is currently having air pushed through it, and if the line is 2way then the direction of air movement will be shown (either in <<, or out >>, and <> means no movement), and you can also hover over the line to get additional information, for example:

Outlets

This section shows all the information related to the different Outlet definitions for the aircraft. Here you can switch the outlet on by checking the checkbox, in which case an Efficiency meter will be shown giving you an idea of the state of the outlet output. Note that some outlets are governed though model behavior code, and as such may only toggle on (or off) for a single frame before the code rests them.
Pressure And Altitude

This section shows all the information related to the different global pressure and altitude values for the aircraft. The information shown here is as follows:
- The cabin altitude rate, which is the climb rate of the simulated pressure in the aircraft, in feet per second (and feet per minute).
- The previous cabin altitude, used for the cabin climb rate calculation.
- The target altitude (in ft) ranging from 0 to 10 000 feet. This is a settable value, but note that any changes made here may be overwritten by the model behavior code of the aircraft.
- The equivalent target pressure of the target altitude.
- The current aircraft pressure, simulated altitude, moles, temperature and total volume (all areas volumes combined).
- The ambient pressure, ie: the pressure outside the aircraft.
- The maximum differencial pressure between the simulated pressure of the cabin and the outside pressure. This is a settable value, but note that any changes made here may be overwritten by the model behavior code of the aircraft.
- The current differencial pressure, in psi (and kilopascals).
Logs
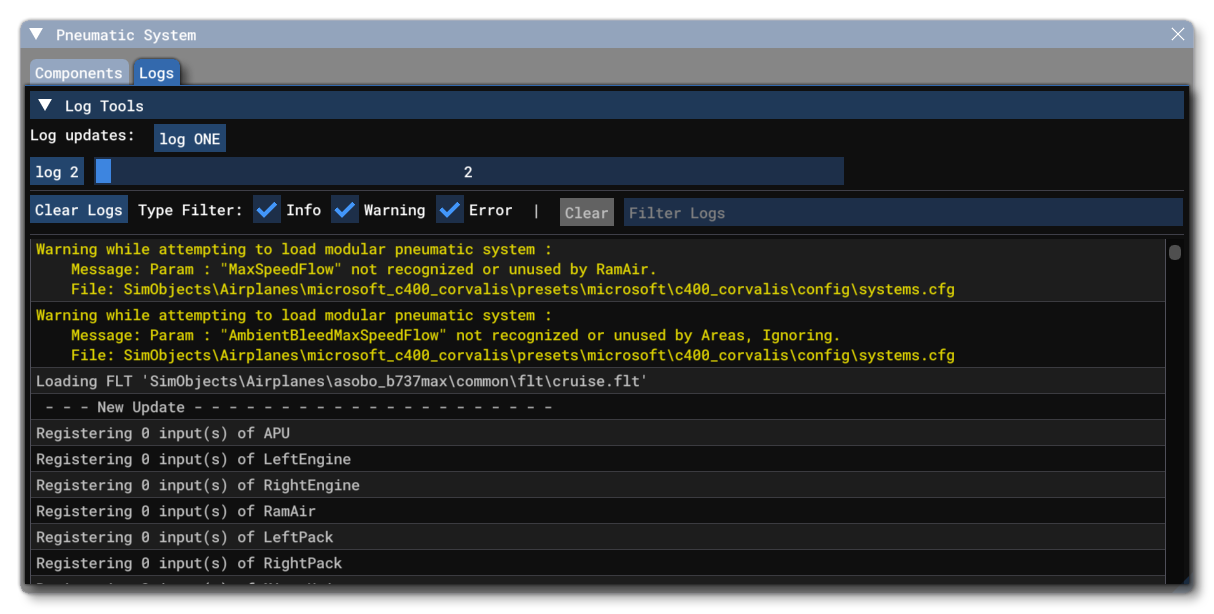
From this tab you can fins information that has been logged about the pneumatics system. The top of this tab has the Log Tools section, with the following options:
- Log Updates - The
Log ONEbutton will generate a single log that contains multiple data points related to the current state of the pneumatics system. Log N- This button will generate N number of logs, generated over N number of simulation update frames. The number of logs generated is set using the slider beside the button.
Under the log updates section you have main log window, along with the standard logging tools: a Clear Logs button to empty the logs window, filter buttons to show / hide errors, warnings and information from the logs, and a filter input box, where you can add some text and filter the output shown to match the given keywords.
Related Topics