BEHAVIORS DEBUG
The Behavior Debug window can be opened from the Tools menu when Developer Mode is active, and the simulation is running (ie: a flight has been started). It is used primarily for debugging the different aspects of the <Behaviors> XML element for an aircraft, but also contains information on many other things like the electrical system, or the fuel system.
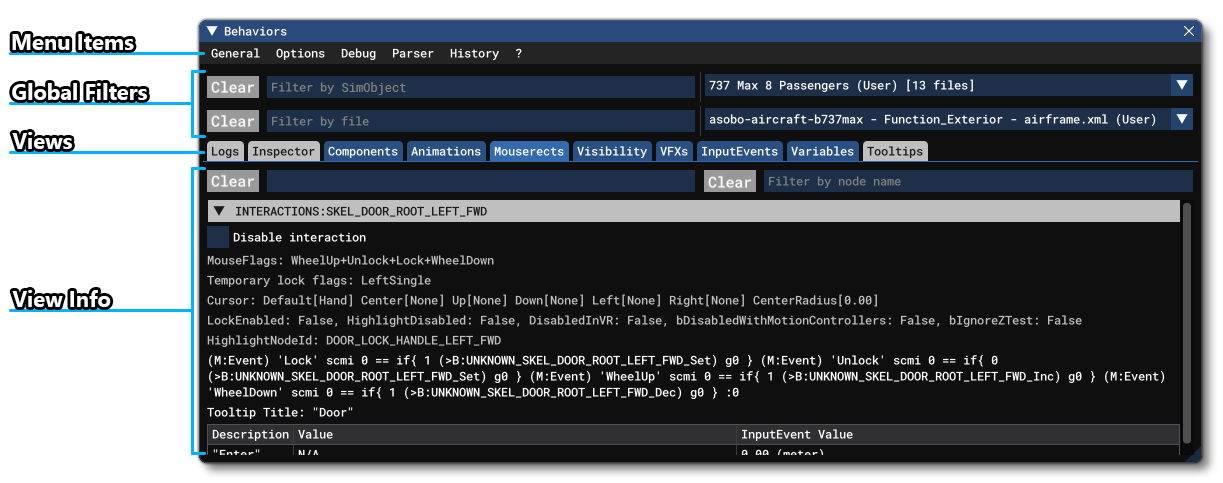
The window looks like this:

Menu Items
The top of the Behaviors Debug window has the following menus:
General

-
File
From the file menu you have the option to Load a SimObject's XML into the Behavior Viewer, or to save a compiled version of the SimObject behaviors, as well as save the actionsaction.dbof this SimObject.
-
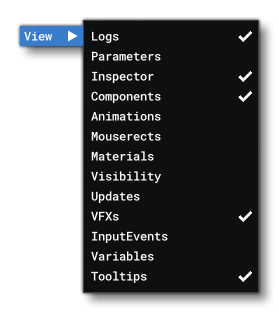
View
From this option you can select one or more Views And View Info to be shown.

Note that not all views are useful, and the editor will automatically hide those that are not relevant to the SimObject XML file currently being inspected. You can find all the information on each available view from the links below:
Code Editor
Inspector Side Bar
Logs
Inspector
Components
Animations
Mouserects
Material
Visibility
Updates
VFX
Input Events
Variables
Tooltips
Options

-
Only Show User SimObject Model Instances
When this option is selected, the Global Filters section will only show those files that are directly from the current package.
-
Only Show Aircraft SimObjects
When this option is selected, the Global Filters section will only show those files that are from aircraft currently active in the scene (both user and AI).
Debug

-
System
From this menu you can open one of the following System Debug views:
-
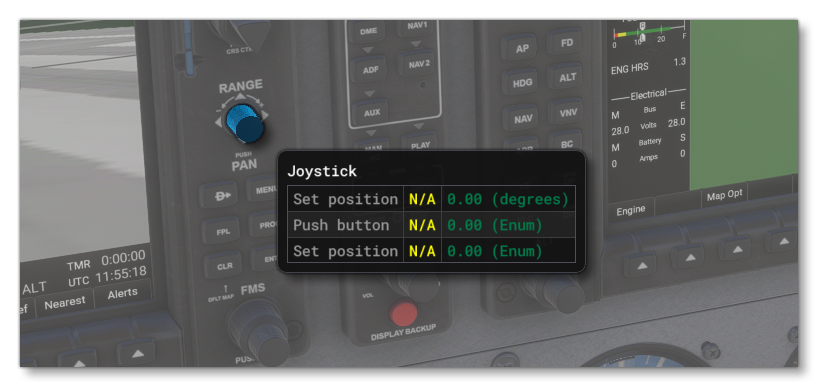
ToolTip
When this option is enabled, mousing over any of the interactable elements in a scene will show a debug "tooltip" with information about the object the mouse is hovering over, for example:

-
Interaction
When this is enabled, all interactables will be highlighted in the scene with a red box and hovering over any of them will show some information about that interactable:

Parser

This option is used to toggle on/off parameter logging. With this option enabled, the target instances XML parameters will be backed up the next time they are parsed giving you access to the Parameters view. To force this, you will need to reload the SimObject.
IMPORTANT! This option is only available for behaviors that are not compiled (ie: are not within the <CompileBehaviors> element). This is usually for legacy aircraft, or for when you are writing your own behaviors and have not yet replaced the <Behaviors> element with <CompileBehaviors>.
If debugging from a busy airport it's advised to also select the target SimObject in the drop-down to avoid parsing parameters of all behavior instances created after activating this option.
History

This menu item simply shows a list of the component history that you have checked previously. You can click on any of the components listed to be taken to that view instantly.
About (?)

This menu item shows information about the currently selected model behavior XML instance. Specifically it shows the name and version of the selected behavior instance, as well as the update times for the different components.
Behavior Viewer
Clicking the Behavior Viewer button will open the viewer tool that permits the examination of any model behavior XML file, regardless of the package that is currently open in the main Behavior Debug window. For more information please see here:
Global Filters
The filters at the top of the Behaviors Debug window can be used to select and filter the different package and XML files that will be available for debugging.
SimObject

Here you can select which SimObject to inspect the files from. All the currently loaded SimObjects will be listed in the drop-down menu on the right for you to select. Should there be many SimObjects in the list, you can use the filter input on the left to narrow down the selection. Once you select a SimObject, you can then select the file to inspect from the Files Filter.
File

Once you have selected a SimObject from the SimObject Filter list, here you can select which XML file from that SimObject to inspect. All the available XML files will be listed in the drop-down menu on the right for you to select one from, and should there be many files in the list, you can use the filter input on the left to narrow down the selection. Once you select a file, the Views section will update with the relevant tabs for debugging the XML contents.
Views And View Info

The majority of the Behaviors Debug window is taken up with the different Views and the information associated with those views. You can switch between the different views by simply clicking on the view Tab at the top. You can also show or hide views using the View Menu (note that not all views are relevant for all XML files, and the editor will automatically select the initial views based on the file being inspected the first time it is selected).
For more information on the available views, please see here:
Note On Dynamic Parameters
When working with model behaviors you have the possibility to use Dynamic Parameters. These may be shown in the Behaviors Debug as '[uid]'_n in the code views, for example:

However, if that is the case for you, you can force the editor to update and show the actual full generated parameter in the debug window by using the right click menu and selecting Open in Code Editor. This will force an update of the Behavior Debug tool, and show the generated value for the dynamic parameters.
Related Topics