DEBUGGING LODS
Once you have your models setup you'll want to debug different things, one of them being the LODs. To permit this, there are a number of tools available from the DevMode menus within Microsoft Flight Simulator 2024 and this page discusses those tools.
NOTE: This page is included in the LODs section to provide a reference when you have your aircraft setup in the simulation, although it may not be relevant at this point right now in the tutorial.
Check LODs Visually
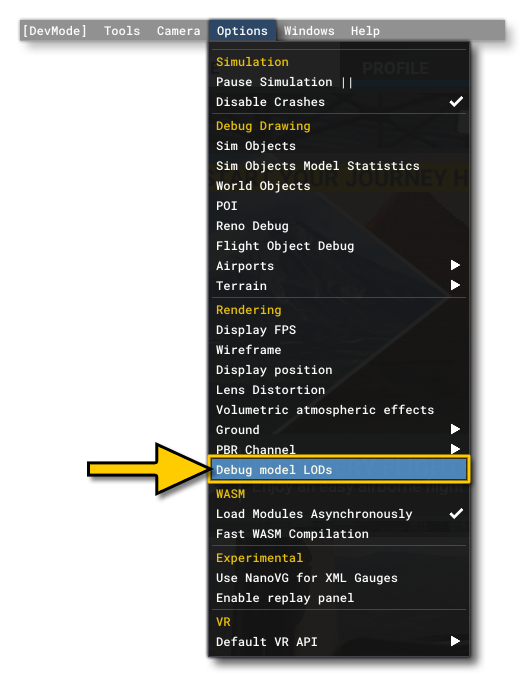
The most important tool you'll have available to you for debugging your aircraft and scenery LODs is from the DevMode Debug menu: Debug Model LODs.
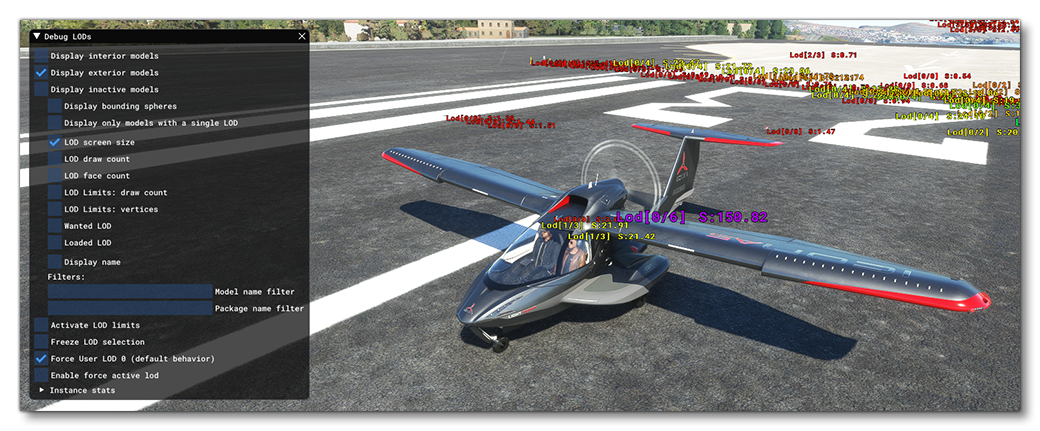
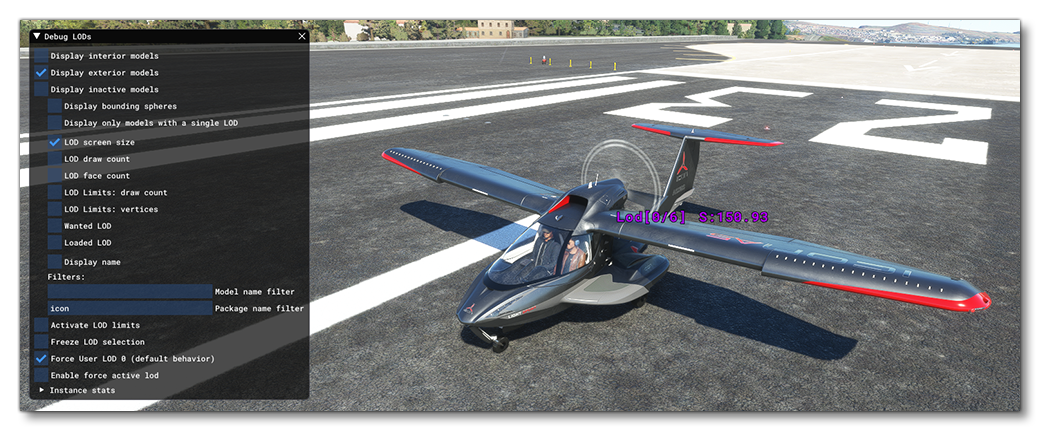
This will then open the Debug Lods window - which has numerous options that can be used for debugging - as well as show an overlay of information within the simulation. At this point we'd recommend that you add the package name to the Package Name Filter, as this will then filter the package details from the overlay, making it a lot easier to read. You can mouse-over the following image to see the difference this makes:
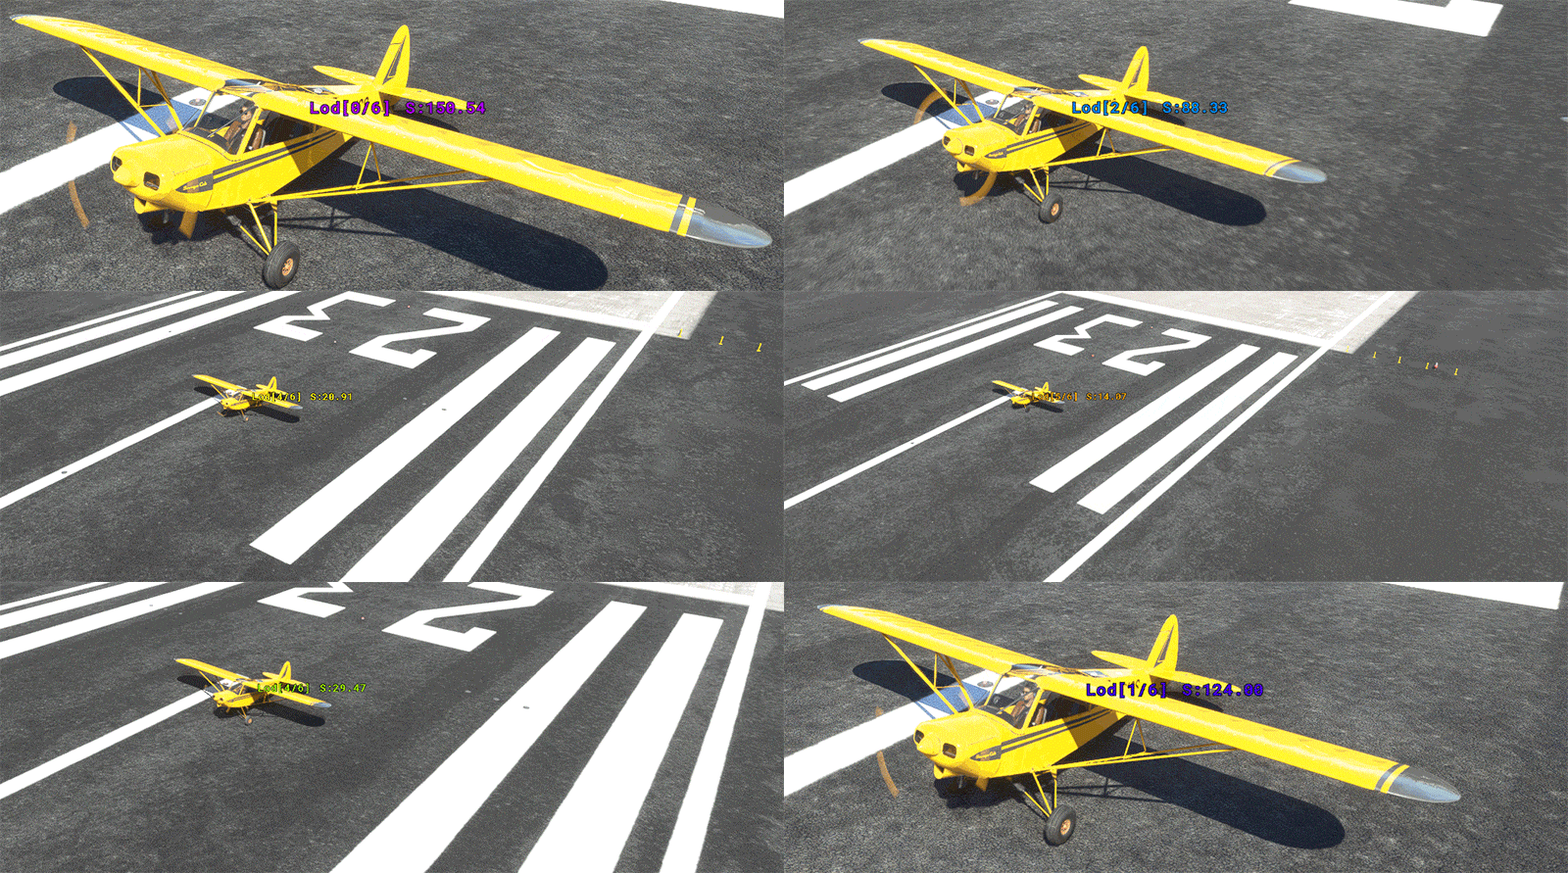
You will also want to un-check the Force User LOD 0 option. By default, the user aircraft is always on LOD x0, but un-checking this option will tell the engine to treat the player aircraft like any other SimObject and change LODs based on the camera position. With this un-checked you can use the Developer Camera to move around and see the LOD values change as the engine changes them:
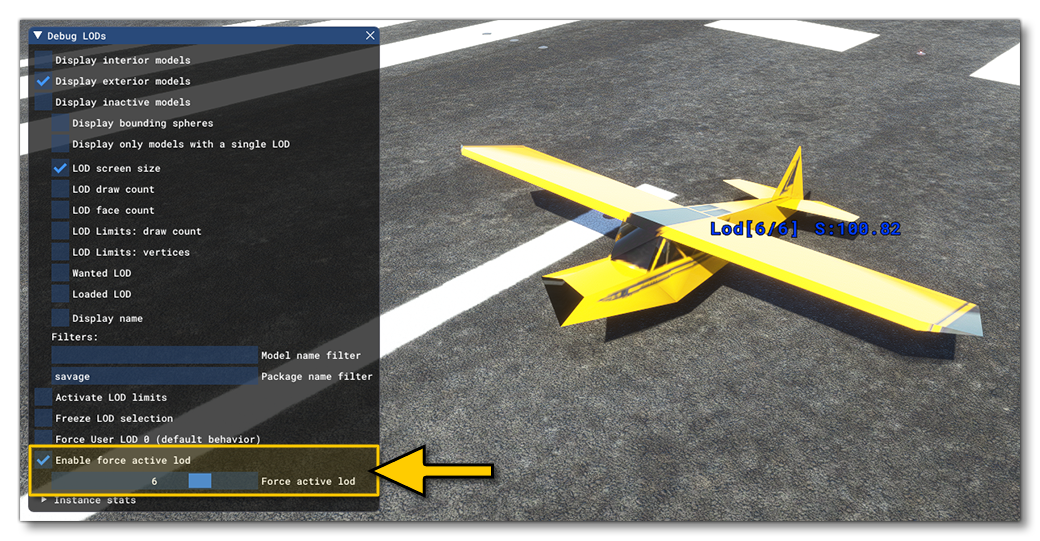
Finally, you can view each LOD up close using a combination of the Developer Camera and the Enable Force Active LOD option, for example:
Check LOD Resources
Once a flight is started, you can get detailed information about the model and the LODs from two different DevMode windows. The first is from the The SimObject Statistics Profiler window, on the Global tab. Here you can select your aircraft from the Airplane list, and when you expand the information you will see some detailed statistics on nodes, vertices, etc... as well as a button to either Load a LOD (if it's not available yet) or a button to Force LOD:
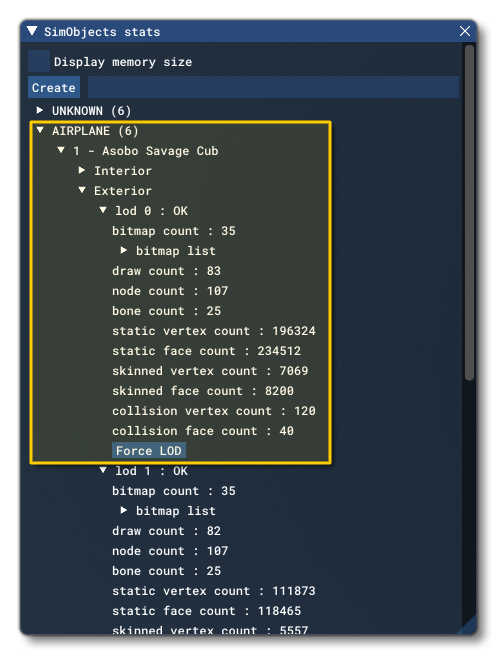
NOTE: The Force LOD button will not do anything if the Debug Model LODs Enable Force Active LOD option is enabled.
The other option you have is to use the Current Container tab, where you can quickly Profile the aircraft to get an isolated performance overview, and then view the Live Stats. The Live Stats section permits you to see a vast amount of information about the different parts of the aircraft model, and you can use the Search For An Object filter to find any specific model part, and then set the following columns (which can be done using the Edit Columns button): LOD, Draw Calls, Static Vertex Count, Original Min Size, Max Draw Calls, Draw/MaxDraw Ratio, Max Vertex Count, Vertex/MaxVertex Ratio.
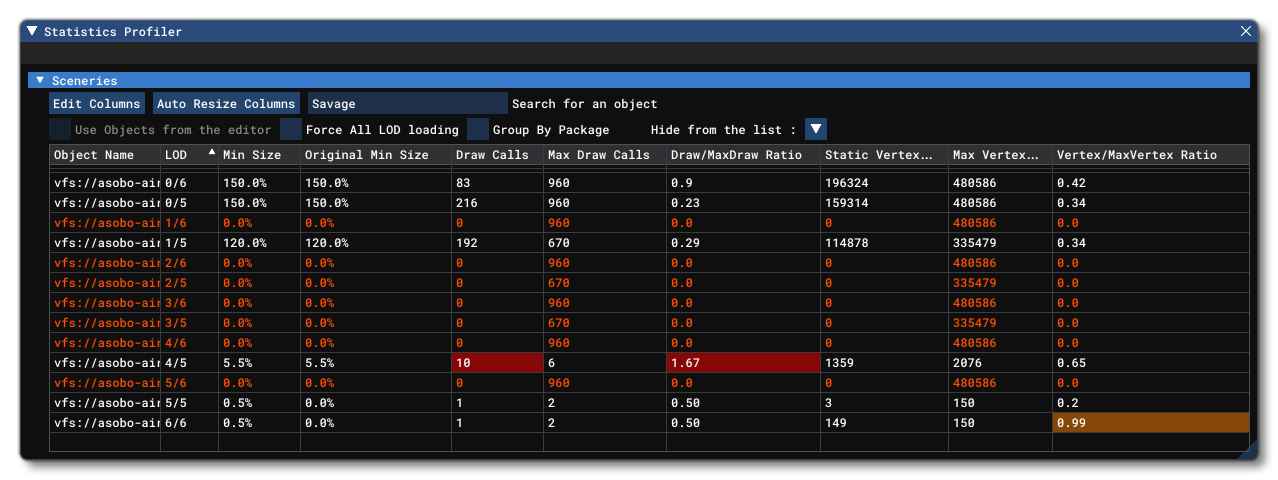
The information here is colour coded so that if you see any field with an orange background then you know that the value is on the limit of what is optimal for the engine, while a red shaded cell is sub-optimal and should be adjusted to get the best performance.
Finally you can use the various debug options available from the Debug LODs window, specifically the LOD Limits: draw count and LOD Limits: vertices options, although the others can also be useful:
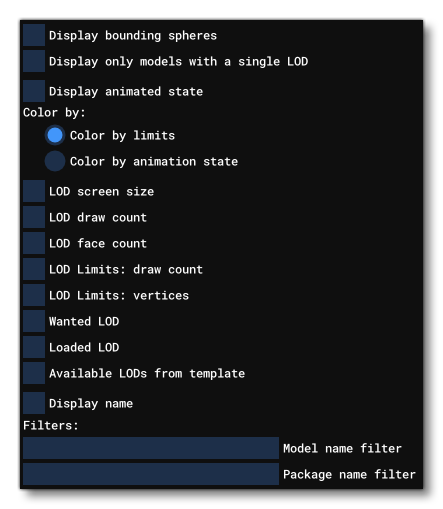
It is also possible to enable/disable the LOD selection system by changing the LOD Limits option:
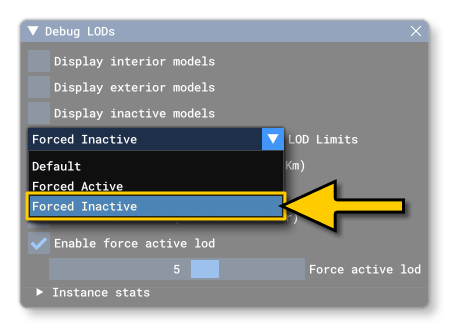
This should be done before you start any flights, but if you enable/disable this option during a flight, you will have to exit the flight, wait 20 seconds, then start a new flight, to see any effect.
How To Find Bad LODs
The instructions below are a basic guide on how to check the LODs for an asset:
- Set your desired graphics quality from the Microsoft Flight Simulator 2024 options ("High" is recommended).
- Open the Debug LOD window, and check if "Activate LOD limits" is active. If it is, then you have to do the following:
- Disable "Activate LOD limits".
- If in a flight, go to the main menu, then wait 20 seconds before continuing.
- Load a flight at your preferred location.
- Now choose your preferred debugging method:
- Using the Debug LOD window:
- Check the "LOD Limits: vertices" checkbox
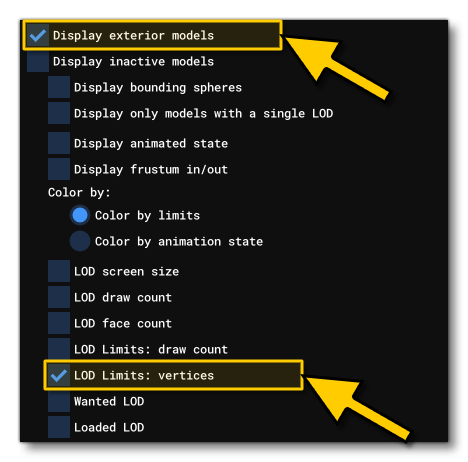
- Any model display that colors red means the currently active LOD will be culled under the new system. If a lower res LOD exists, it will switch to that, otherwise it will disappear completely.
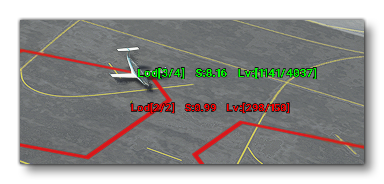
- Check the "LOD Limits: vertices" checkbox
- Using the Statistics Profiler tool:
- Click the "Edit Columns" button and select these columns: LOD, Draw Calls, Static Vertex Count, Original Min Size, Max Draw Calls, Draw/MaxDraw Ratio, Max Vertex Count, Vertex/MaxVertex Ratio.
- Make sure the "Use Objects From Editor" checkbox is disabled (to be able to view independent model stats).
- Any cell that appears in RED (over the limit) or ORANGE (close to the limit) is a value that needs to be optimized.

You can also mouse over the LOD entries flagged in red or orange to get an idea of what the issue is:

- Using the Debug LOD window:
Related Topics