DEBUG

This menu controls a number of different simulator and developer mode options to help with creating your add-on content. The options available to you from this menu are listed below.
-
Console
This will open the Developer Mode output Console. This window displays information about the current state of the engine and of Developer Mode. For more information see the page on The Console.
Debug Drawing
-
Sim Objects
Selecting this will open the SimObject Containers window, where you can view general information and debug the various SimObjects in the current simulation scene. For more information, see SimObject Containers.
-
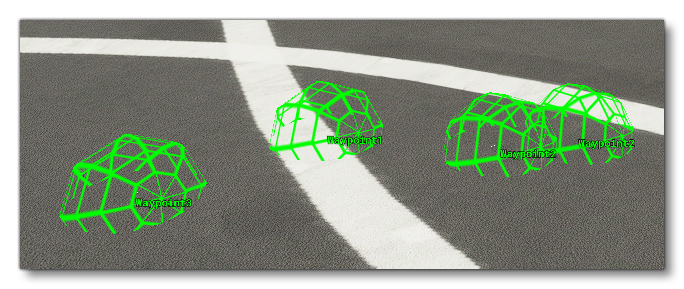
World Objects
This option will show certain debug information for world objects and markers in the simulation. You'll get "spheres" (spherical meshes) to show data like waypoints and also overlay text.
-
SimProp Containers

This window is used to debug SimPropContainer Objects. The window is split into two parts, with some general display options at the top, and then a list of available SimProp Containers (those that are currently loaded into the simulation) which you can expand to get information on. The draw options are as follows:-
Draw Sphere: When checked, this will draw a sphere mesh to signal the position of the different SimProp Containers in the scene.
-
Sphere Radius: This is used to control the visual size of the sphere mesh used to signal the position of the different SimProp Containers in the scene.
-
Draw Name: When checked, the name of the SimProp Container will be displayed in the scene.
-
Draw LLA: When checked, the position of the SimProp Container will be displayed in the scene as Lat / Lon / Alt. Note that this requires the "Draw Name" option to be checked to be visible.
-
Draw Rotation: When checked, the rotation of the SimProp Container will be displayed in the scene as Pitch / Bank / Heading. Note that this requires the "Draw Name" option to be checked to be visible.
-
Draw Distance: When checked, the distance from the camera for the SimProp Container will be displayed in the scene. Note that this requires the "Draw Name" option to be checked to be visible.
Note that you can click on a sphere in the scene to select it and this will open the corresponding entry in the SimProp list (as well as colour the selected SimProp sphere yellow).
-
-
Collisions
When you hover over this option you will be presented with the following two checkboxes (assuming you are in a flight, as the option will be unavailable in the menus):
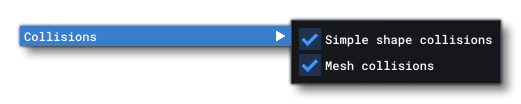 Selecting either (or both) of these will add debug drawing for the Simple Shape Collisions and for the Mesh Collisions of the different scenery and simulation objects (including the user aircraft):
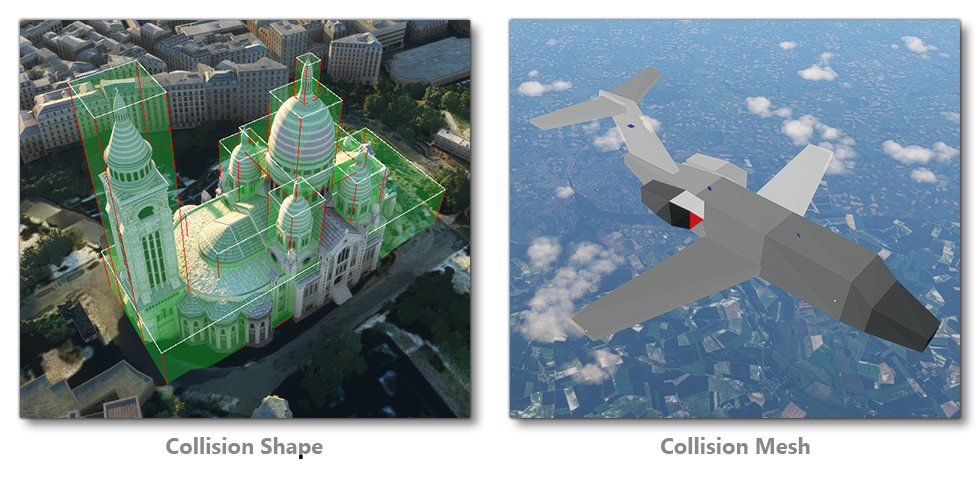 Note that the Mesh Collision checkbox will also render the Cockpit DRONE_COLLISION_IN mesh. Also note that if collisions are disabled in the engine for an object that has a collision shape, then the bounding boxes will be rendered using dashed lines.
-
Web View Profiler
This will open the Web View Profiler window where you can get information on the different parts of the simulation that use HTML to display information (like the EFB or glass cockpit displays). You can find full details on using this window from the following page: Web View Profiler
-
Flight Object Debug
Enabling this option when within a flight or a mission will show the main Flight Object Debug window: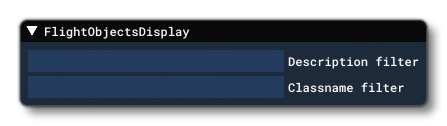 And may also show different sub-windows, eg:
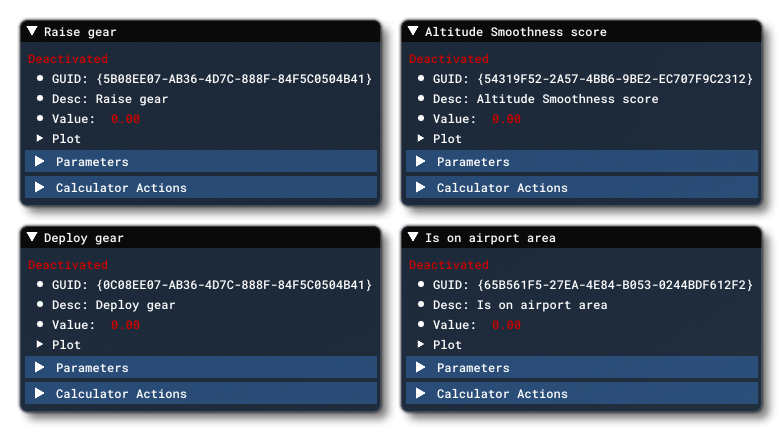 This tool is for debugging the different mission calculators when in a flight, and each sub-window will display the internal logic for the different calculators available. These sub-windows can be filtered from the main window using the following input fields:
- Description Filter: filters the sub-windows based on the description field in the calculator.
- Classname Filter: filters the sub-windows based on the classname of the calculator.
-
Aircraft
This option opens a sub-menu where you can access the various debug windows that are used to debug the performance of the current aircraft being flown. You can find all the information about these windows from the following section: SimObject Debug Menu
-
Airports
This option opens a sub-menu where you can enable airport debugging. For more information on the options in this sub-menu please see here.
-
Terrain
This option opens a sub-menu where you can enable airport debugging. For more information on the options in this sub-menu please see here.
Rendering
-
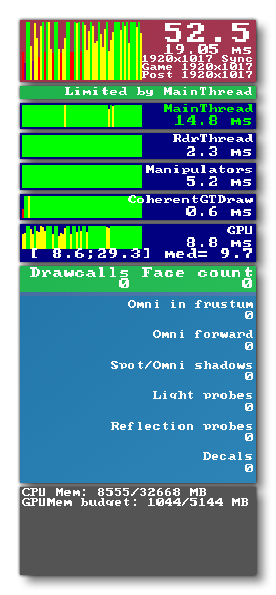
Display FPS
Enabling this option will show the current FPS of the simulator as well as some additional performance related debug information.
-
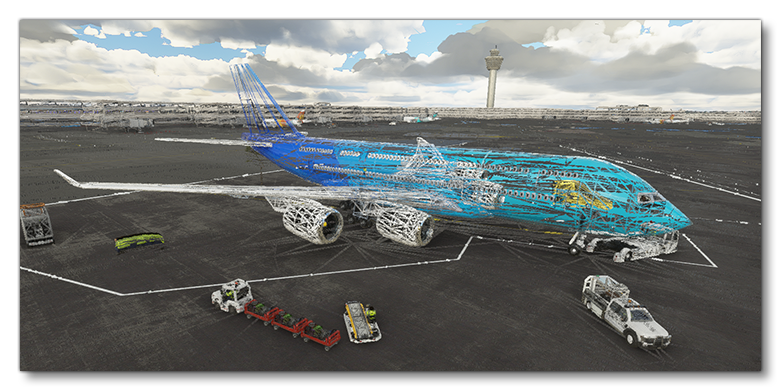
Wireframe
This enables the wireframe view of the simulation, where all models are rendered as wireframe meshes.
-
Display Position
Selecting this will open the Position window:
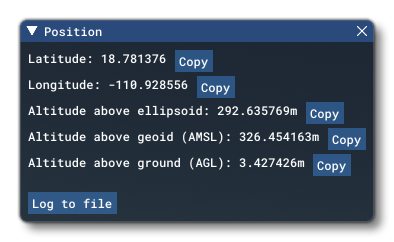 This shows the position of the current selected aircraft within the world. Each individual positional value can be copied to the clipboard using the Copy button, or you can click the Log to file button to open a file explorer window and save out a text file with all of the data. Note that if you save the file you will also have to add the extension as part of the file name, for example "
Position.txt".
-
Debug Model LODs
Enabling this option will open the Debug LODs window where you have multiple options to show the LODs and LOD-related data overlaid on the simulation. For full information on the options present in this window, please see the Debug LODs section.
-
Debug Scenery Packages
When this is enabled, the simulation will display a text message showing the package to which the different scenery items that are in the scene belong. For example:

Sound
-
Sound Limiter
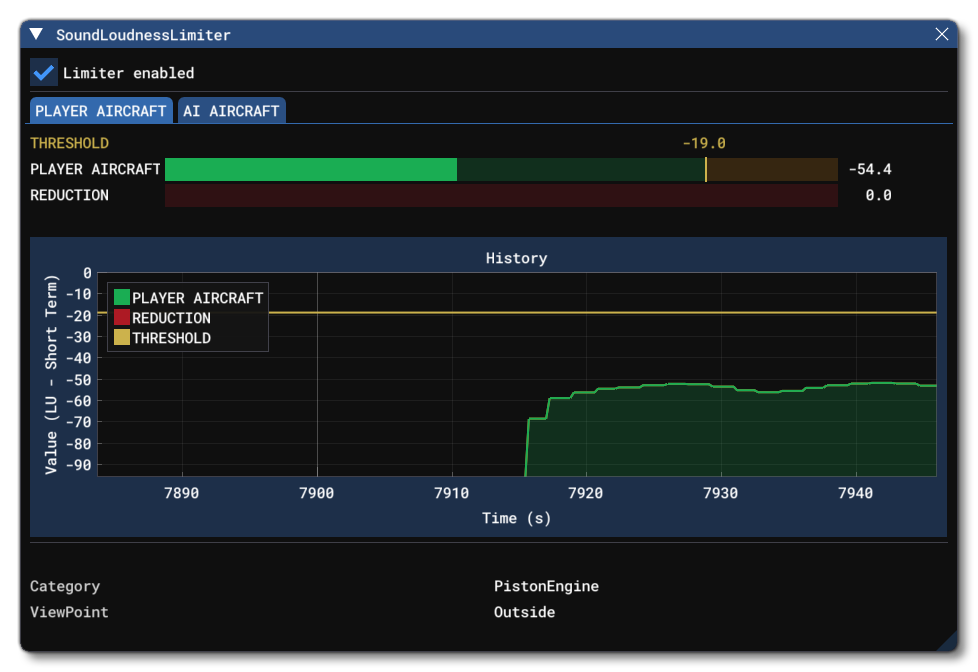
All aircraft in Microsoft Flight Simulator should be mixed respecting the ITU-R BS 1770-3 recommendations to ensure mix consistency between all Microsoft Flight Simulator partners and add-on creators. To help with this, the simulation now includes a sound Limiter option in the settings menu, which prevents the recommended sound levels from being exceeded in order to achieve loudness audio consistency throughout the MSFS 2024 experience for the user. The Sound Limiter debug window let's you visualise the sound limiter in real-time as the simulation runs, making it easier to correct the audio mix of both user and AI aircraft, if necessary.
WASM
-
Display WASM Debug Window
Enabling this option will show the WASM Debug window, explained in more detail here: WASM Debug
Flight Plan
-
Display Flight Planning Services Debug Window
This window is primarily designed for people creating flight planning apps or glass cockpit displays showing the aeronautical navigation charts for an airport. For full information on this window, please see the following page:
Controls
-
Device Presets
Coming Soon.
-
Device Data
Coming Soon.
-
Input Actions List
Coming Soon.
Experimental
IMPORTANT! Features placed in this section are those which may - or may not - become final features of the SDK. Using these features is done at your own risk as they may impact the stability of the simulation and DevMode tools.
-
Debug Unit Conversions
This option will open a small window with a single option to Use precise constants and unit conversions. THis will be checked by default. With Microsoft Flight Simulator 2024, the conversion of units and the precision many internal constants were improved. However, this may cause issue with some aircraft, and it would be difficult to pinpoint those kinds of issues. So, if you have a hard-to-pin-down issue, this option can be unchecked to see if the aircraft issues are resolved, thus telling you that you need to check values that use built-in constants or conversions.
-
Debug Weather
Selecting this option will open the Debug Weather Sim window, which is described in full on the following page:
-
Debug Vegetation
When enabled, this option will open a new window with debug information related to the drawing of vegetation in the scene: This window has all the data that is related to the vegetation rendering, and is directly affected by the two in-sim options for Terrain Level Of Detail and Tree density:
  Both these options will affect how the vegetation is rendered along with the values that the debug window displays. You can also visualise the difference these options make by enabling the Show Vegetation In Red option, which will then shade all the vegetation bright red and permit you to better visualise the impact of the different detail options, as shown in the image below:

-
Debug Procedural Generation
Coming Soon.
-
Use New LOD Curve
This option is enabled by default and tells the simulation to use the "new" LOD curve for LOD switching. The new LOD curve (max vertex count vs vertical screen size) is split into two parts: linear from 0% to 100%, parabolic above 100%, meaning more vertices for sizes up to 100% and the same amount for above 100%. When this option is disabled, the old - linear - LOD curve will be used. For more information on LODs, please see here: LOD Selection System
-
Debug Platform Dispatcher
This window can be used to help debug the different APIs that transfer messages between the various programming platforms used by add-ons. For full information, please see here: Debug Platform Dispatcher
Related Topics