AIRCRAFT DEBUG MENU
This page explains the different debug options available to you when using The Aircraft Editor (or when debugging an aircraft using the Aircraft menu from the DevMode Debug menu).
For additional details on using the information provided here, please see the section on Defining A Flight Model.
AP (Autopilot)
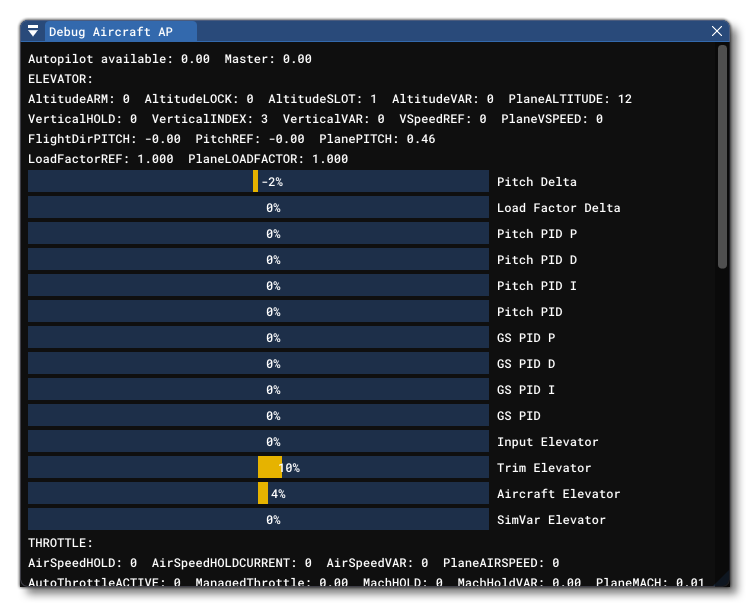 This window displays debug information related to the aircraft AutoPilot. In general this is split into 4 major sections:
- Elevator
- Ailerons
- Rudder
- Throttle
Most of the information in this window is defined through the AI Config file for the aircraft, and you can also edit the associated parameters from the Autopilot And AI tab in the main Aircraft Editor.
Drag
 This window shows the different values that are associated with - and will affect - the different drag formulas for the aircraft. Values are measured on the aircraft in flight as it is currently being simulated.
CFD
 This option will open the CFD (Computational Fluid Dynamics) Debug window. This is used to computationally simulate the flow of air around the aircraft and is designed to help you better understand the and improve the aerodynamics and handling of the aircraft.
IMPORTANT! This is currently a new feature that has been made public so that you can test it and compare results. Feedback, issues and errors related to this feature can be posted on the Official Dev Support Forum.
You can find full information on this window, how to use it, and how it works, from the following page:
Stall
 This window shows information that can be used to debug and resolve issues related to the aircraft stall speeds and AoA.
Engines
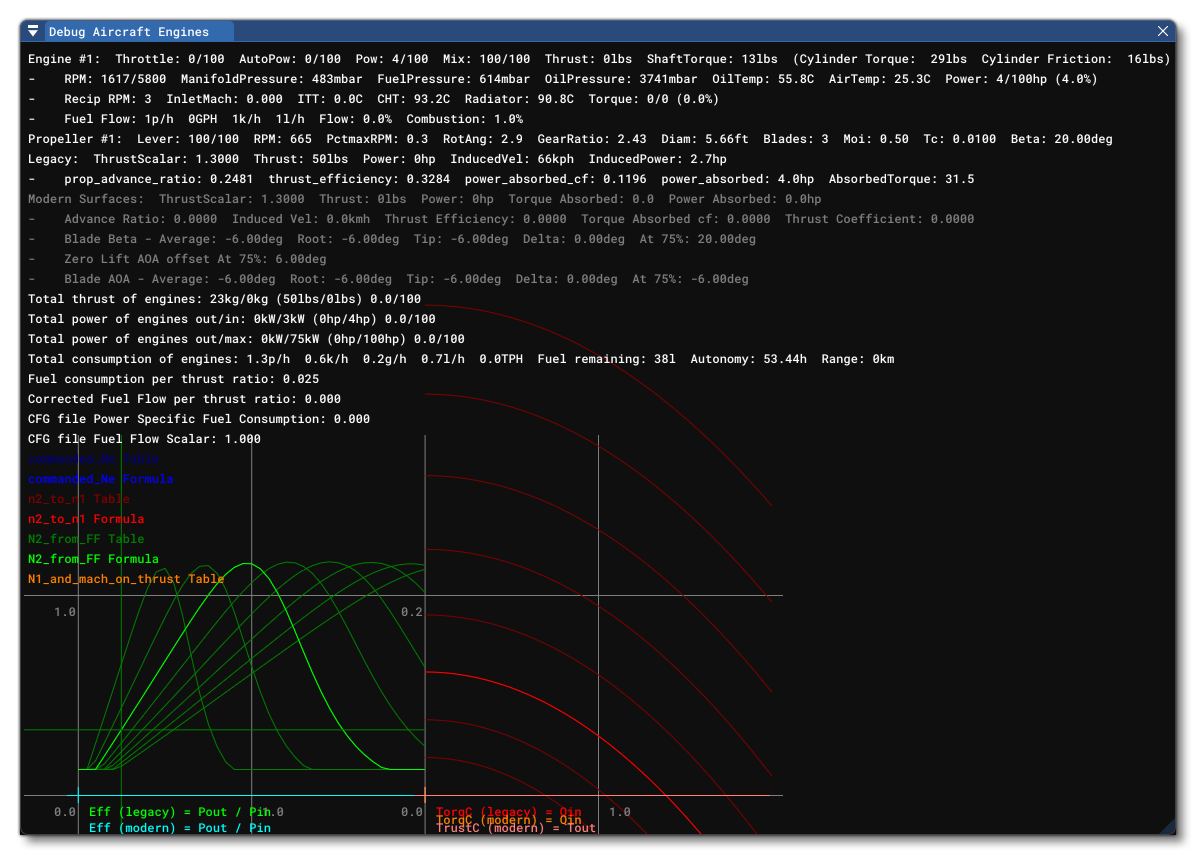 This window displays information about the different engine(s) for the aircraft as well as their position. The data shown in this window can be changed by editing the Engine Config file, as well as by editing the values in the Engine tab of the main Aircraft Editor.
Ground Effect

This debug window can be used to display various different values associated with the ground effect and how it affects various aircraft parameters.
Interactive Points
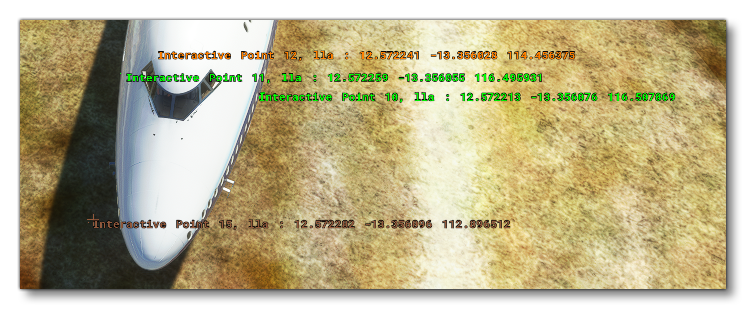 When this option is selected, the aircraft will show the interactive points overlay. When active, each interactive point will be displayed - colour coded to show which type of point it is - along with it's position relative to the Datum Reference Point. This position, and other values, can be edited from the Interactive Points section in the main Aircraft Editor. The colours used are as follows:
 Green: Main Exit
 Orange: Cargo Exit
 Red: Emergency Exit
 Yellow: Gas Trap / Fuel Hose
 Brown: Ground Power Unit
 Dark Blue: Air Start Unit
Legacy
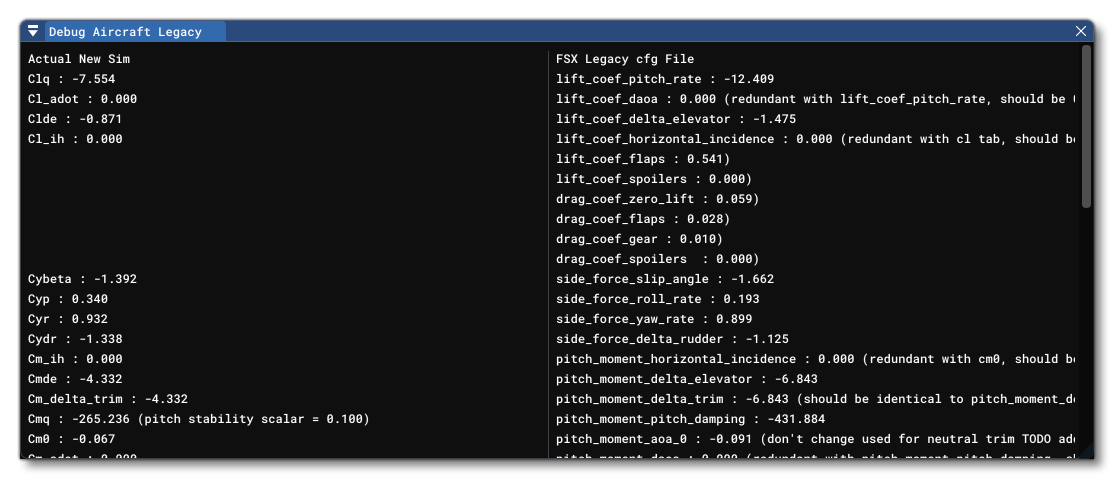 This debug window is designed to help you update any legacy FSX aircraft to work with the updated, modern flight model in Microsoft Flight Simulator 2020. When opened, this window will create a "virtual wind tunnel" and essentially place the aircraft in it and use the legacy values to generate a comparative set of modern flight model values, which can then be added into the [CONTACT_POINTS] section of the Flight Model Config file.
The window is split into two parts:
- the legacy parameter values on the right
- the modern flight model values on the left
The idea here is that you use this comparison to update the aircraft CFG files by changing the parameters listed on the right with the values listed on the left. For example, in the image above the legacy parameter lift_coef_delta_elevator has a value of -1.806. However on the left this is represented as the \(C_{LDe}\) value which is -1.334. So you should take this value and in the CFG file edit the lift_coef_delta_elevator to be -1.334 to update the legacy values to suit the modern flight model. Doing this for all the listed values should bring the legacy aircraft parameters close to the values required for Microsoft Flight Simulator 2020.
Lights
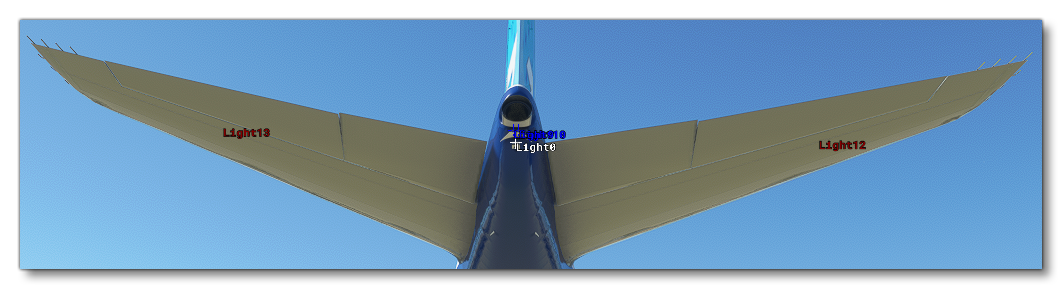 When this is enabled, all the lights that have been defined for the aircraft will be signaled by an overlay of coloured text, and some may also show the name of any emissive effects that have been assigned to them, as well as the range and area over which they will be visible. Note that this overlay will also be automatically enabled when you select the Lights section in the Aircraft Editor.
Each colour used in the overlay represents a type of light, specifically:
 White: Strobe
 Red: Beacon
 Dark Blue: Navigation
 Yellow: Panel
 Green: Landing
 Dark Grey: Taxi
 Purple: Recognition
 Light Grey: Wing
 Dark Red: Logo
 Orange: Cabin
 Brown: Pedestal
 Blue: Glareshield
 Pink: Ambient
Shadow Sphere
When this option is enabled, the shadow sphere will be drawn onto the scene, showing the area that defines the first shadow map for the aircraft. You can use this overlay to debug the shadow sphere that is created using The Cameras Tab in the aircraft editor (see Notes For The Shadow Sphere for more information).
Pitch
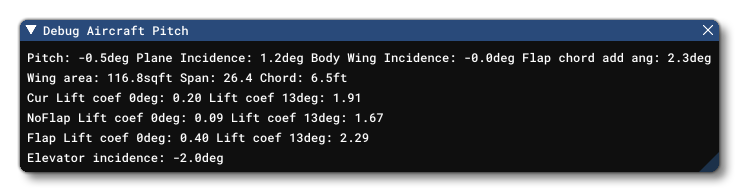 This debug window is used for debugging the various parameters related to pitch from the Aerodynamics section of The Aircraft Editor. When this debug window is enabled, the simulation will be overlaid with a virtual "wind tunnel" showing a schematic of the aircraft from the side:
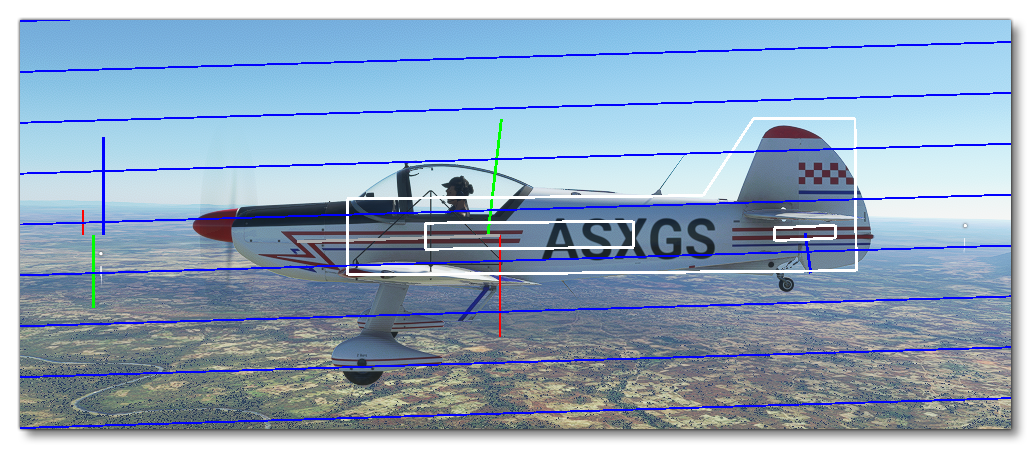 This visualisation can be used to help visually balance out the different forces that affect the aircraft pitch. In this simulation:
- the blue lines that cross the screen represent the airflow so you can visually see your incidence by comparing it to the white schematic of the aircraft.
- the green line on the wing schematic indicates the lift + drag forces acting on the wing
- the red line on the wing schematic indicates the gravity force and direction
- the blue line on the elevator schematic indicates the lift force on the elevator
The three line graph on the left is also used to represent the active roll (red), pitch(green) and yaw(blue) torques.
Sim
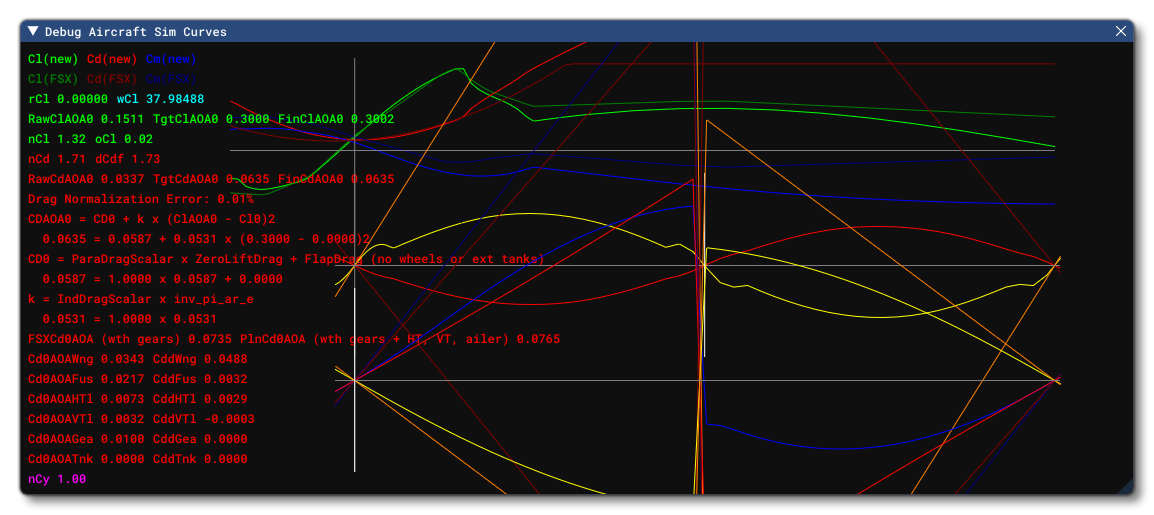 These windows are used to show some "general" information about the simulation as well as activate certain overlays. This option acts as a quick way to enable the Sim Dimensions, Sim Info and Sim Forces overlays, since activating the Sim option will also show the overlays associated with those individual debug options.
In general, the graphic represents the following:
Green = Lift coefficient vs AoA.
Red = Drag coefficient vs AoA.
Blue = \(C_m / {AoA}\) (pitch moment vs AoA).
Other Colours: Roll and sideslip.
As well as activating those other overlays, this option will open a Sim Curves window with some values and a graph.
NOTE: This window is a work in progress and currently has little practical application.
Sim Dimensions
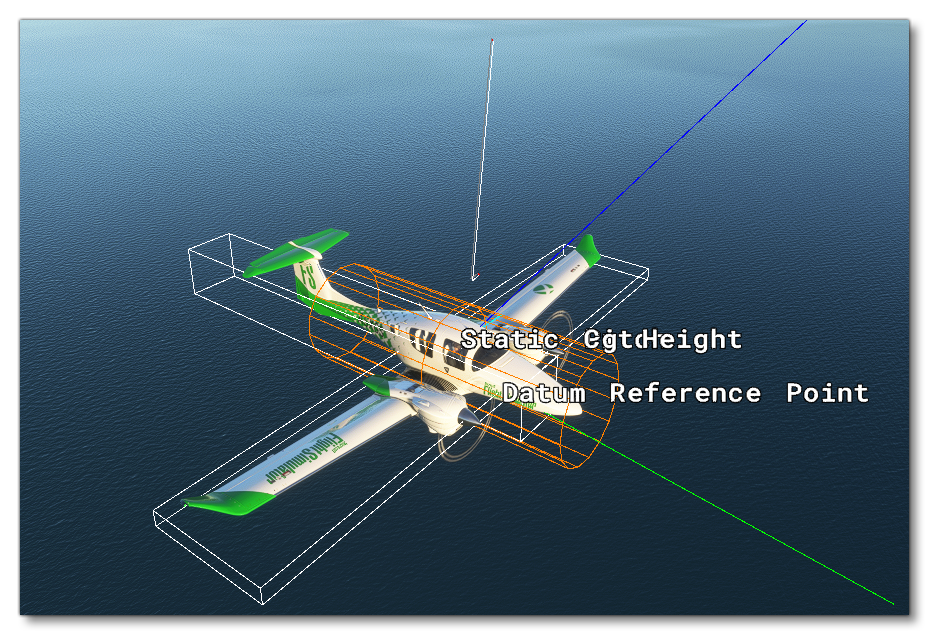
With this option you can enable the dimensions overlay which will show the approximate dimensions of the aircraft based on the values input in the Airplane Geometry section of the main Aircraft Editor. With this overlay you can see the fuselage "shell" in orange and the basic aircraft shape in white, and the Datum Reference Point is marked along with the Static Center Of Gravity Height. When this overlay is active, you will also be shown coloured lines that represent some of the forces acting upon the aircraft geometry. This overlay is also activated automatically if you enable the Sim option from the debug menu.
Sim Info
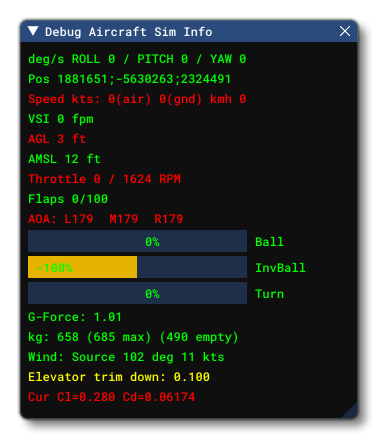 This window shows some general information about the actual state of the simulation for the aircraft. The window is also shown automatically if you enable the Sim option from the debug menu.
Sim Forces
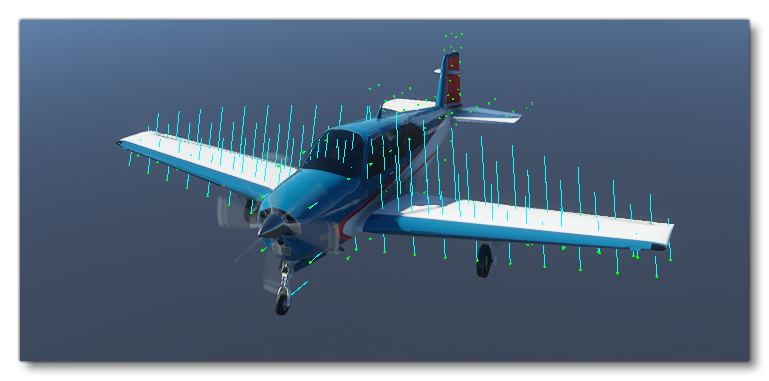
With this overlay enabled, you can see a visual representation of the forces that are active on each of the "sample points" used by the flight model to determine how the aircraft flies. These force markers are updated in real-time as you fly the aircraft and will be modified by changing the values in the Airplane Geometry and Aerodynamics tabs in the main Aircraft Editor. This overlay is also activated if you enable the Sim option from the debug menu.
Sim Polar ClCd
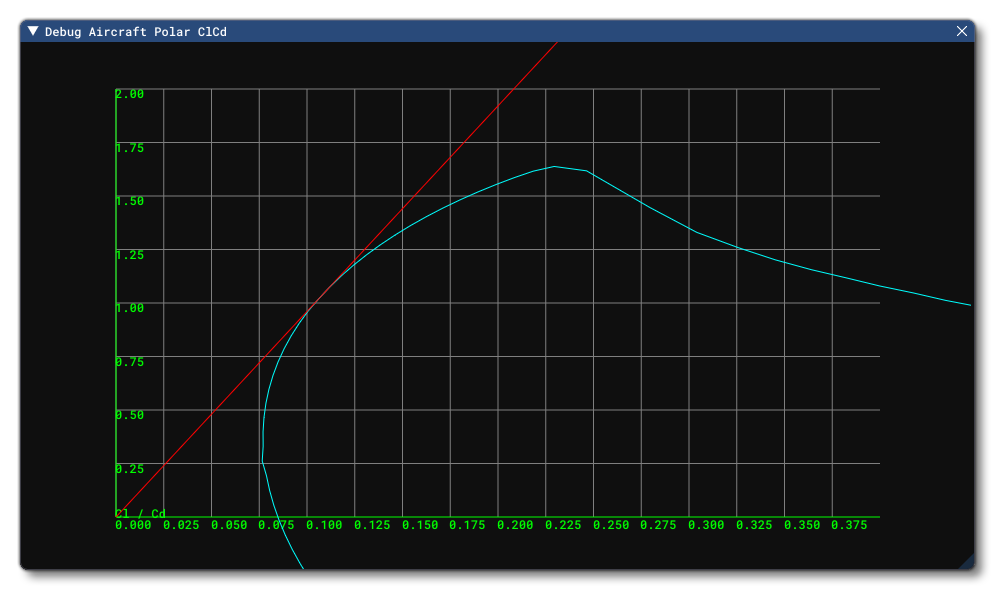 When activated this option will open a Sim Curves window with a graph that plots the variation of the \(C_D\) (drag coefficient) as a function of \(C_L\) (lift coefficient) for you to study - this is the blue line on the graph, also called the drag/lift polar. This graph will show as well the tangent to the curve - the red line on the graph - starting from the axis origin and demonstrating the best AoA for the best \(C_L / C_D\) ratio on the polar curve.
WARNING! Activating this window will require Microsoft Flight Simulator 2020 to use a lot more processing power, and as such may lag the simulation.
Sim Polar Power
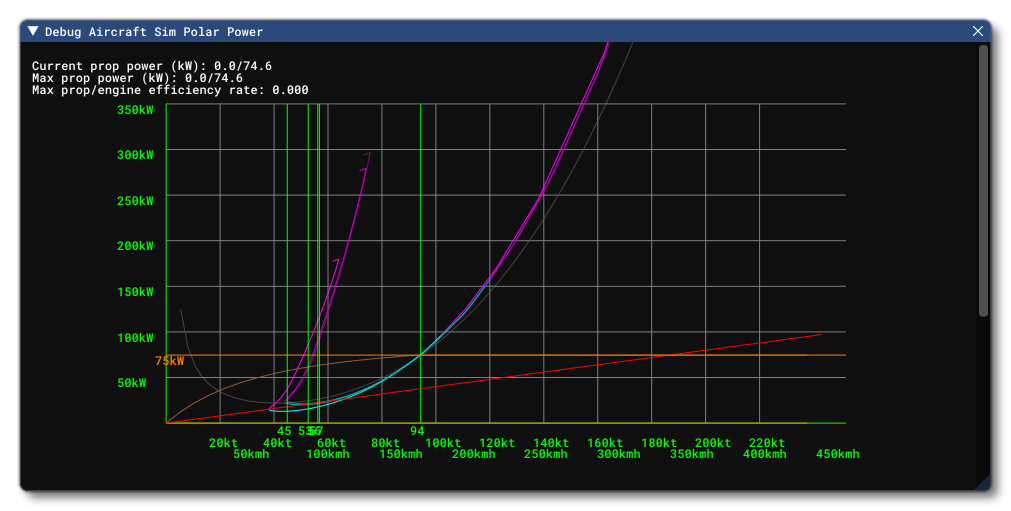 When activated this option will open a Sim Curves window with a graph that plots various curves related to the engine power and speed, essentially allowing you to see how much power is required versus how much power you have.
WARNING! Activating this window will require Microsoft Flight Simulator 2020 to use a lot more processing power, and as such may lag the simulation.
Sim Polar VhVs
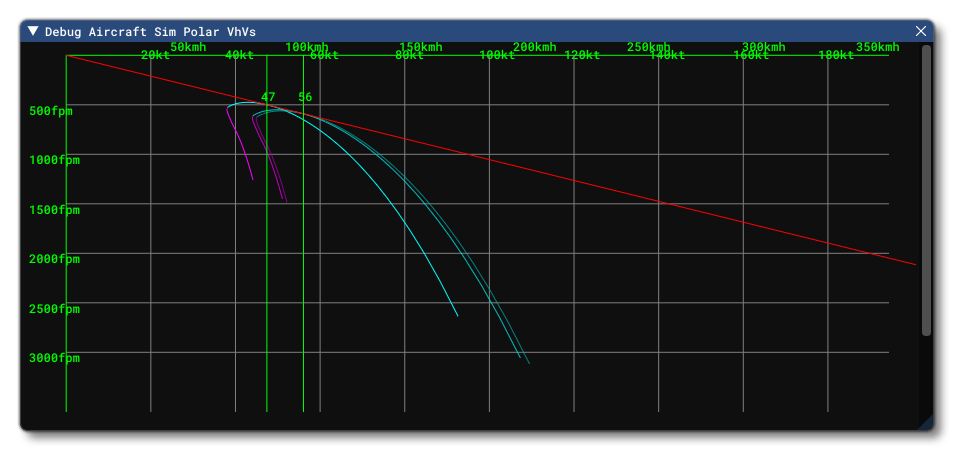 When activated this option will open a Sim Curves window with a graph that plots curves related to the polar \(V_h\) and \(V_s\) values. This allows you to see how much height you lose when gliding and at what speed.
WARNING! Activating this window will require Microsoft Flight Simulator 2020 to use a lot more processing power, and as such may lag the simulation.
Sim Tuning
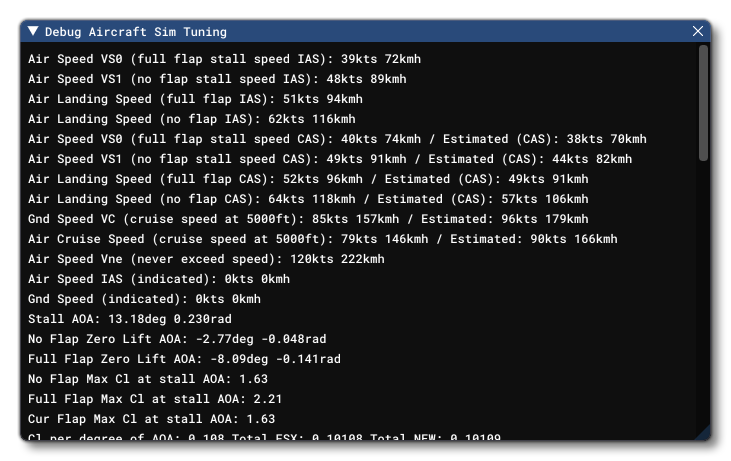 This window lists a number of important parameters related to the aircraft that can be studied as the aircraft flies. This window will also open automatically when the Weight And Balance section is selected in the main Aircraft Editor.
Speed
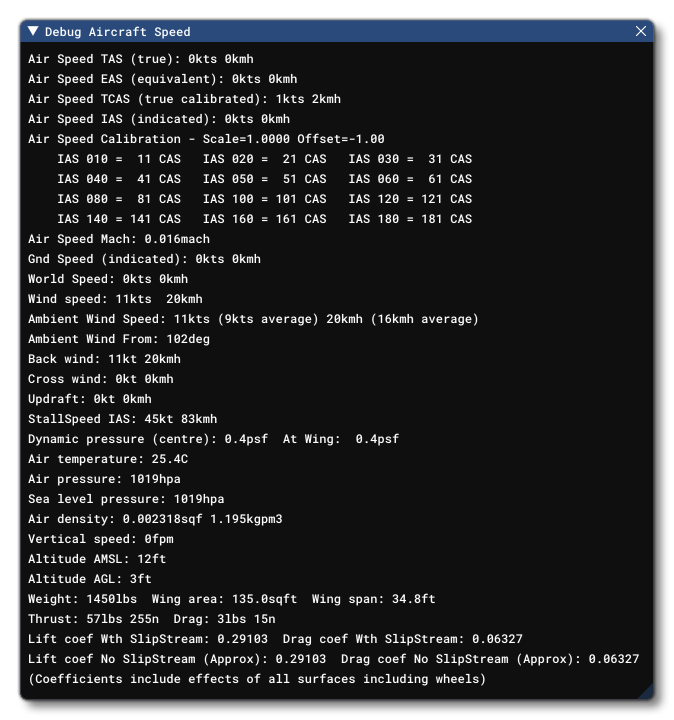 This window lists a number of important parameters related to the speed at which the aircraft is flying, as well as some parameters that will affect how speed is calculated, the maximum speed, etc...
Tracking
![]() This window shows a combination of common parameters that can be used to track the performance and behaviour of the aircraft. The following parameters are worth noting:
This window shows a combination of common parameters that can be used to track the performance and behaviour of the aircraft. The following parameters are worth noting:
- Simulated stall speed: computed from the sum of all lift forces the aircraft can produce in its current configuration (weight, gear landing), taking all control surfaces into account. That's the real stall speed of the flight model.
- Estimated stall speed: computed from the values provided in the
[REFERENCE SPEEDS]section, taking only flaps position and weight into account. So basically an interpolation based on POH values you provided - Lowest selectable speed: Set to 1.23 x Estimated Stall Speed
Weight
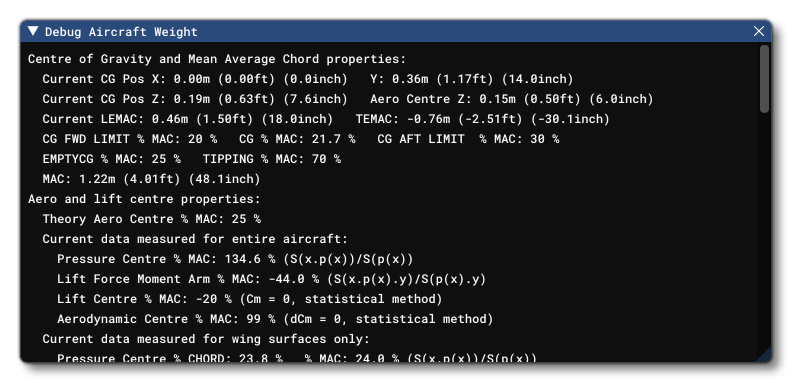
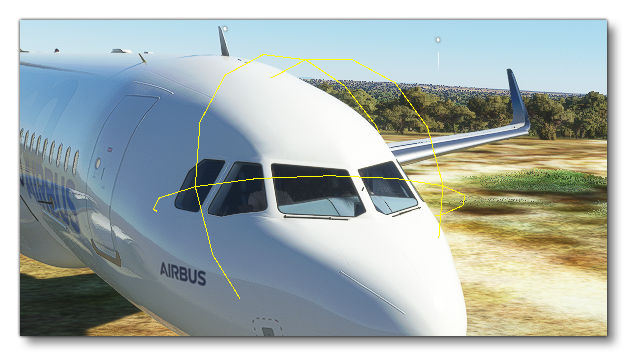
This window can be used to display the different weight parameters as well as the parameters that affect the weight. At the same time, this option will show an overlay on the aircraft displaying all the parts of the aircraft that can be modified to affect the weight and balance, including the landing gear, the engine, the pilot and copilot, etc...
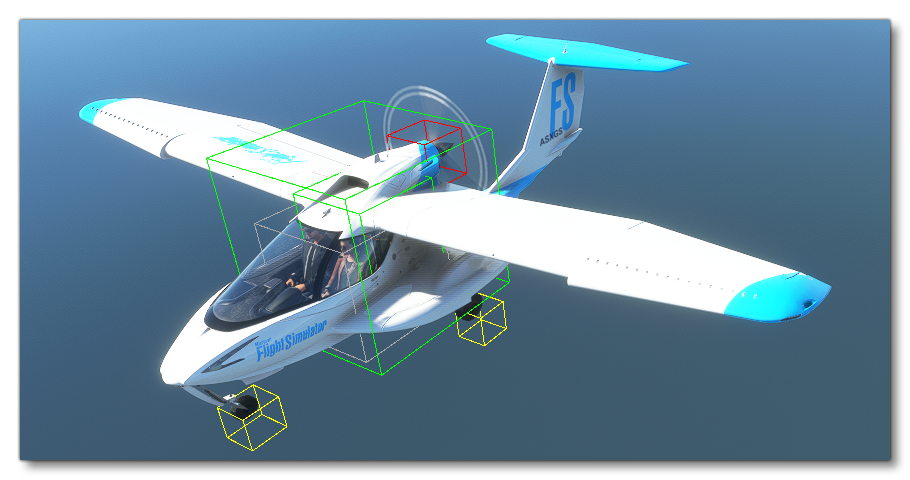
This overlay and window will also be automatically activated when you select the Weight And Balance tab in the main Aircraft Editor.
Wheels
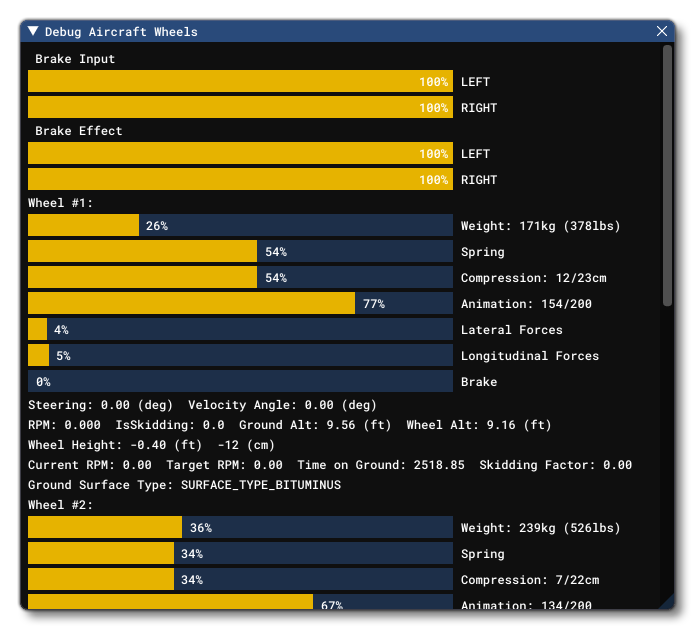 When you select this option, the debug wheels window will open and display information related to each of the wheels/landing gear defined for the aircraft. Enabling this option will also enable the wheels and contact points overlay:
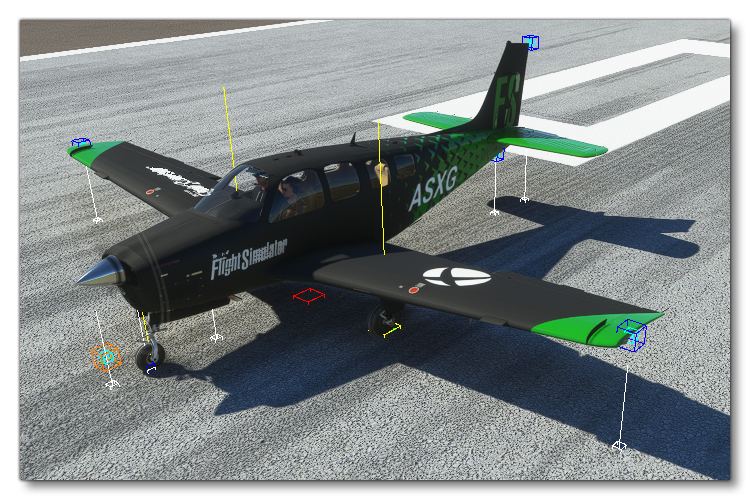
In this overlay, each contact point (wheels are also considered as contact points) will be shown with a coloured square at the point of contact which has been defined for it in the aircraft parameters. Each point will also be projected along a white line onto the ground. The colours used are as follows:
- Green: Wheel
- Dark Blue: Scrape Point
 Black: Skid
- Light Blue: Float
 Cyan: Water Rudder
- Light Grey: Ski
- Orange: Propeller
This window and the overlay will also be automatically activated when you select the Contact Points section in the main Aircraft Editor.
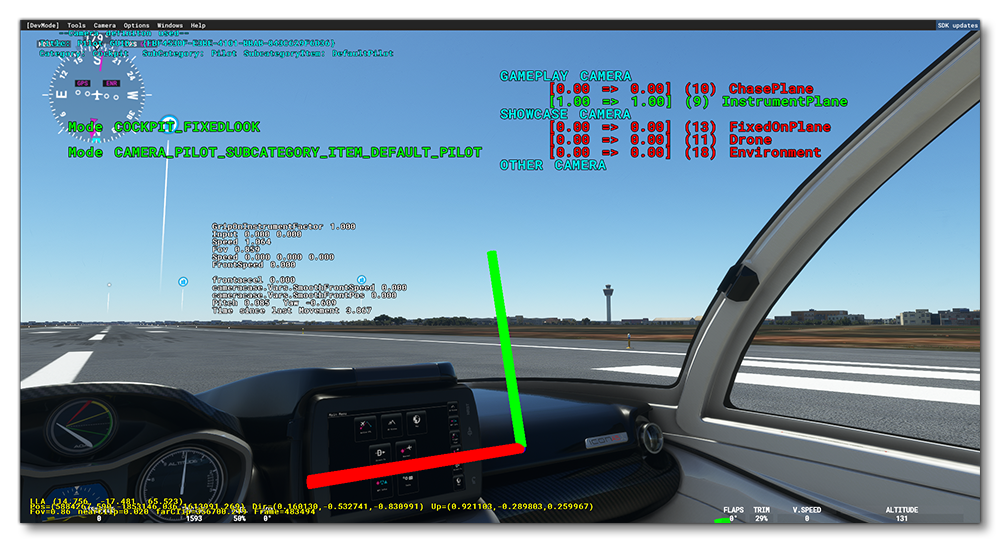
Camera Blend
This debug feature is for cameras and will enable an overlay with multiple points of information related to the current camera and the cameras available.
Aircraft Data

This window is designed so that you can load in a CSV file with real aircraft data and compare it to the performance of the aircraft in the simulation. When you start a flight, the data for specific items will be recorded - the items being set by the various "Data Feed" parameters - and a sample of the data will also be graphed over time at the bottom of the window. The available options here are as follows:
- Pause Recording: when checked, all data recording will be paused.
- Pause At Event: when checked, specific timed events will automatically pause the data recording. The exact moment that the pause will occur will depend on the data feed parameter, with the pause happening when the sample data goes above a specific threshold, as shown in the following table.
Parameter Threshold NoneN/A AoA Alpha20 Pitch25 Roll60 Yaw Sideslip Beta25 Elevator Deflection35 Aileron Deflection30 Rudder Deflection30 Load Factor5 Vertical Speed3000 Vertical Wind3000 True Air Speed200 From .CSV25
- Data Feed 1 - 4: Here you can select which parameter to use as the data feed(s).
- Feed Offset: This slider permits you to offset the data visually in the graph view by +/- 20 frames.
- Load .csv Into Feed 1 - 4: Clicking this will automatically load the CSV file from the given Filename location.
- Save Feed 1 - 4 To .csv: Clicking this will automatically save a CSV file with the feed parameter data to the location given as the Filename location.
WARNING! This will overwrite any existing file with the same name at that location! - Filename 1 - 4: Gives the path and filename for the CSV file to be loaded/saved.
- Max Time 5s, 15s, 30s, 60s: These option can be used to expand/contract the visual sample shown in the grapht view at the bottom.